GEO & AI Search
Monthly GEO Reporting Template for Clients
Quick Answer
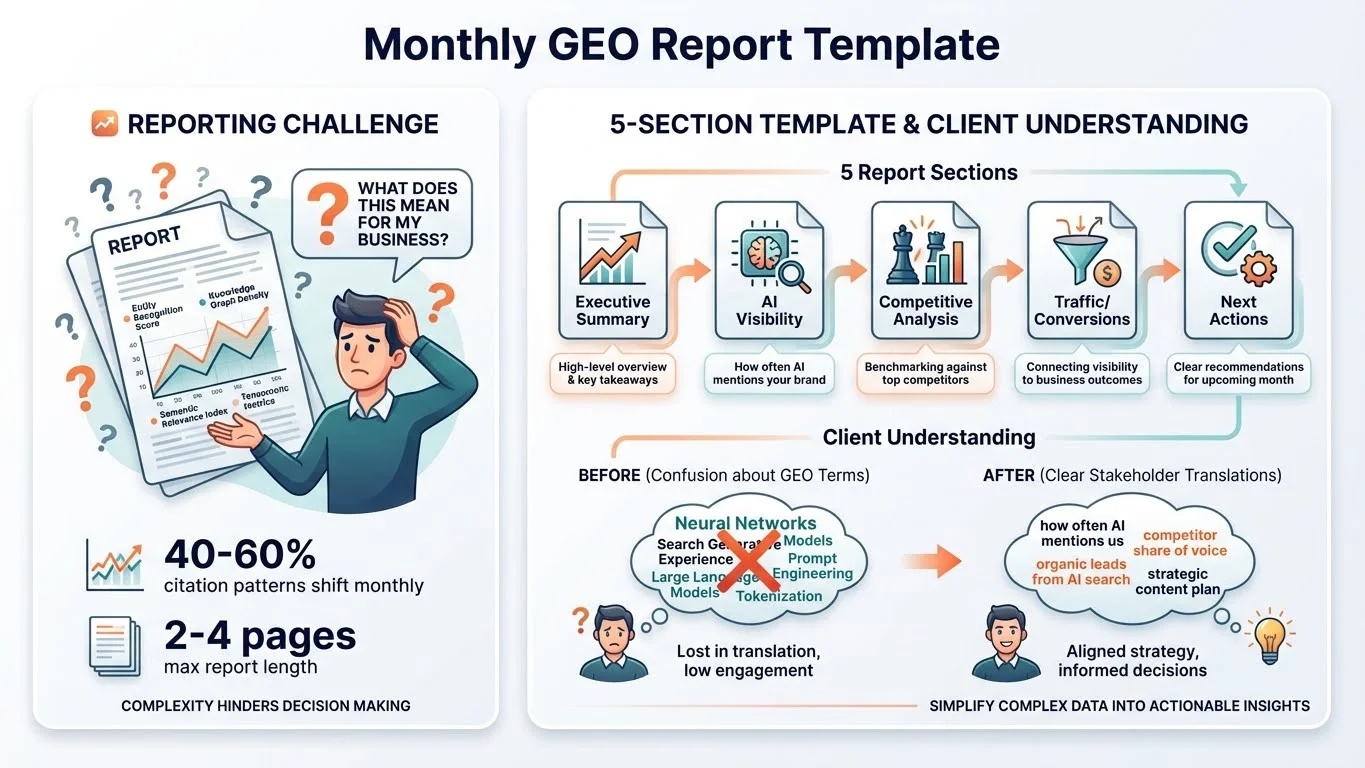
A monthly GEO report needs 5 sections: Executive Summary (3-5 key wins), AI Visibility Metrics (citation frequency, brand mentions, platform breakdown), Competitive Analysis (Share of Voice vs 2-3 competitors), Traffic and Conversions (AI referral data from GA4), and Next Month Actions (2-3 specific priorities). Keep it to 2-4 pages maximum. Lead with wins, provide context for metrics stakeholders don't understand yet, and always end with clear next steps. This template gives clients what SEO reports taught them to expect while introducing the metrics that actually matter for AI search.
It's the last Friday of the month. Your client expects a report. You have citation data from three platforms, GA4 traffic that doesn't separate AI referrals, competitive insights from manual testing, and no template that makes sense of any of it.
Traditional SEO reports have a familiar structure: rankings, traffic, backlinks, actions. Clients know what to expect. GEO doesn't have that yet. Every agency is inventing their own format, and most clients don't understand what they're looking at.
This guide gives you the complete template-battle-tested across client engagements-for monthly GEO reporting that stakeholders actually understand and value. Every section, every metric, every framework you need to copy.
45
days for executive readout
Best practice: First substantial report to stakeholders by day 45 of engagement.
Source: Foundation Inc →40-60%
citation pattern shift monthly (Confirmed March 2026)
AI citations are volatile-monthly reporting catches changes before they compound. This benchmark remains valid as of March 2026.
Source: TryProfound →2-7
domains cited per AI response
Limited citation slots make Share of Voice a critical competitive metric.
Source: TryProfound →Why GEO Reports Require a Different Structure
SEO reports have a 20-year head start. Clients know what "Position 3 for target keyword" means. They understand traffic graphs. They expect backlink counts. GEO introduces metrics most stakeholders have never seen-citation frequency, Share of AI Voice, brand mention sentiment-and a fundamental shift in what "visibility" means.
The Reporting Paradigm Shift
The challenge isn't just new metrics-it's new mental models. When AI answers a question using your content but doesn't send traffic, how do you report that value? When your Citation Frequency is 15% but your competitor's is 25%, what does that mean for next month's strategy?
Definition
GEO Report
A monthly client deliverable that tracks AI search visibility, competitive positioning, and business impact. Unlike SEO reports (which focus on ranking positions and traffic), GEO reports measure influence-how often AI platforms cite, recommend, or mention your client's brand in response to relevant queries.
GEO Reporting Fundamentals
- ✓ Track visibility without clicks - A ChatGPT citation that mentions your brand without a link still builds awareness. SEO reports miss this.
- ✓ Break down by platform - ChatGPT, Perplexity, Claude, Gemini each cite differently. Aggregate numbers hide where you're winning or losing.
- ✓ Include competitive context - Citation Frequency alone means nothing. 15% could be leading or lagging. Always show Share of Voice.
- ✓ Set longer timelines - GEO improvements take 60-90 days for existing content, 90-180 days for new. Track leading indicators.
Pro Tip
The first three months of GEO reporting are education months. Spend 30% of your report explaining what the metrics mean and why they matter. By month four, clients will understand the framework and you can shift to pure performance analysis.
The 5 Essential Report Sections
Every monthly GEO report should follow this structure. It mirrors what clients expect from SEO reports (executive summary, metrics, competitive analysis, actions) while introducing GEO-specific elements. Consistency builds trust-use the same format every month.
How to Read This Flow: Each step is one section of your report. Work left to right. The page estimates show approximate length-keep your total report to 2-4 pages.
Monthly GEO Report Structure
- 1
Executive Summary
3-5 key wins and insights (1/2 page)
- 2
AI Visibility Metrics
Citation frequency, mentions, platform breakdown (1 page)
- 3
Competitive Analysis
Share of Voice vs 2-3 competitors (1/2 page)
- 4
Traffic & Conversions
AI referral data from GA4 (1/2 page)
- 5
Next Month Actions
2-3 specific priorities with rationale (1/2 page)
Total length: 2-4 pages. Anything longer and clients won't read it. Put raw data in an appendix or linked dashboard, not the main report. The goal is actionable insight, not comprehensive documentation.
Section 1: Executive Summary
The Executive Summary is the only section many stakeholders will read. It must answer three questions in 30 seconds: What happened this month? Is that good or bad? What are we doing about it?
Executive Summary Template
Headline Metric
"[Client name] appeared in [X]% of AI responses for target queries this month, [up/down] from [Y]% last month."
Key Wins (3-5 bullets)
"• Citation frequency increased 23% for [category] queries
• First-time citation in Perplexity for [specific query]
• AI referral traffic up 15% MoM, converting at 3.2%"
Context Statement
"These gains position [Client] as the #2 cited brand in [category], behind [Competitor] and ahead of [Competitor B]."
Next Month Preview
"Next month: Expand [specific content type] to target [emerging query category] where competitor visibility is low."
Pro Tip
Write the Executive Summary last, after completing all other sections. It should synthesize insights from the full report, not just introduce what's coming. Many clients will only read this page-make it count.
Section 2: AI Visibility Metrics
This is the core of your GEO report-the metrics that define AI search performance. Include three to four key metrics with month-over-month trends and brief explanatory context for stakeholders still learning the framework.
How to Read This Table: Each row represents a core GEO metric. The "What to Report" column shows what data to include; "How to Present" shows formatting recommendations; "Stakeholder Translation" provides language clients will understand.
AI Visibility Metrics: What to Include
| Metric | What to Report | How to Present | Stakeholder Translation |
|---|---|---|---|
| Citation Frequency | % of target queries where client is cited | Line chart with MoM trend | "How often AI mentions us" |
| Brand Visibility Score | % of queries where brand is mentioned (with or without link) | Single number + delta | "How visible we are in AI answers" |
| Platform Breakdown | Citation % by platform (ChatGPT, Perplexity, Claude, etc.) | Horizontal bar chart | "Where we're winning vs. losing" |
| Content Prominence | Position in AI response (primary source vs. supporting mention) | Pie chart: primary/secondary/mentioned | "How prominently we're featured" |
Metric Spotlight: Citation Frequency
Citation Frequency is your headline metric-the GEO equivalent of "keyword ranking." Present it as the primary number in every report.
Citation Frequency = (Queries where client is cited ÷ Total target queries tested) × 100
How to Present Each Metric: Follow this sequence when building your report's visibility section. Each step builds on the previous one-by the end, stakeholders understand not just what the numbers are, but what they mean for the business.
Presenting Visibility Metrics to Clients
- Lead with the headline number
Lead with the headline number
Start with Citation Frequency as a single, prominent figure. '23% of AI responses cite your content.' Then add context: 'Up from 18% last month, and above the industry average of 12%.'
- Show the trend, not just the snapshot
Show the trend, not just the snapshot
Include a 3-6 month trend line. Single month numbers fluctuate; trends reveal real progress. 'Citation Frequency has grown from 8% to 23% over 6 months' is more meaningful than '23% this month.'
- Break down by platform
Break down by platform
Different platforms have different citation patterns. 'ChatGPT cites us 28% of the time; Perplexity only 12%.' This identifies where to focus optimization effort next month.
- Include brief metric definitions
Include brief metric definitions
For the first 3-4 months, add a one-sentence definition under each metric. 'Citation Frequency: How often AI platforms reference our content when users ask relevant questions.' Remove once clients are familiar.
Section 3: Competitive Analysis
Metrics without context are meaningless. A 20% Citation Frequency could be category-leading or lagging-it depends entirely on competitors. This section positions your client in the market and identifies strategic opportunities.
2-7
domains cited per AI response
Limited citation slots make competitive positioning a zero-sum game. Every spot your competitor holds is a spot you don't.
Source: TryProfoundWhat to include: Track 2-3 key competitors monthly. Show Share of Voice (your citations ÷ total citations for all tracked brands), highlight who gained or lost ground, and identify specific queries where competitors dominate that represent opportunities.
Competitive Analysis Template
Share of Voice Summary
"For [category] queries, [Client] holds 28% Share of Voice. [Competitor A] leads at 35%, [Competitor B] at 22%, others at 15%."
Movement This Month
"[Client] gained 5 points; [Competitor A] lost 3 points. Gap narrowing-now 7 points vs. 15 points last quarter."
Opportunity Queries
"[Competitor A] dominates 'best [product] for [use case]' queries (80% SoV). Content gap identified-no [Client] content addresses this angle."
Pro Tip
Don't include more than 3 competitors. Too many makes the analysis noisy and hard to act on. Pick your primary competitor (biggest threat) and two secondary competitors (similar size or emerging challengers). Review this selection quarterly.
Section 4: Traffic and Conversions
This section bridges GEO visibility metrics to business outcomes clients care about. AI referral traffic and conversion data prove that AI visibility translates to real business value-not just awareness.
GA4 AI Traffic Channel Setup
What it does: Creates a dedicated channel group in GA4 that separates AI referral traffic from other referral sources. Essential for accurate reporting.
Your input: GA4 Admin access (Editor or Administrator role).
Expected output: "AI Traffic" appears as a separate row in all Traffic Acquisition reports.
What to do next: Wait 24-48 hours for data to populate. Then export monthly for your report.
AI Traffic Regex Pattern for GA4:
chatgpt\.com|chat-gpt\.org|claude\.ai|openai\.com|perplexity\.ai|copilot\.microsoft\.com|gemini\.google\.com|mistral\.ai|deepseek\.com|phind\.com|you\.com|x\.ai|grok\.x\.com|meta\.ai|cohere\.com
How to Read This Funnel: Each stage narrows as we move from raw visibility to business outcomes. Report all four levels-stakeholders need to see the full picture from citations to revenue.
GEO Value Flow: From Visibility to Revenue
Citations
AI Visibility
How often AI platforms mention or cite your content
Traffic
AI Referral Sessions
Actual visits from ChatGPT, Perplexity, Claude, etc.
Leads/Sales
Conversions
AI visitors who take action (3x higher than organic)
$$
Revenue Attribution
Business value tied to AI-referred conversions
"AI-referred visitors convert at 3x the rate of traditional organic search visitors. They arrive with clearer intent and stronger pre-qualification because AI platforms have already vetted your relevance."
Note
If AI traffic is small (under 100 sessions/month), focus your report on visibility metrics instead. Traffic is a lagging indicator-citation frequency improves before traffic does. Set expectations that traffic growth typically lags visibility gains by 30-60 days.
Section 5: Next Month Actions
Every report must end with clear next steps. This section proves you're not just reporting data-you're using it to drive strategy. Limit to 2-3 specific, actionable priorities. More than that dilutes focus.
How to Use This Decision Guide: Find the scenario that matches your current data. The corresponding priority becomes your top action for next month. Most reports will match one primary scenario.
Choosing Next Month's Priorities
Question
What does your data tell you?
Priority: Entity establishment and foundational schema. Content can't get cited if AI doesn't recognize who you are.
Priority: Optimize for linking platforms (Perplexity, Google AI Overviews). ChatGPT citations build awareness; Perplexity drives clicks.
Priority: Competitive content analysis. Identify what they're doing that works and develop content to compete directly.
Priority: Landing page optimization. Traffic is coming-now make sure it converts when it arrives.
Based on which scenario matched your data above, use the template below to document your specific actions. The priority from the decision guide becomes Action 1-then add supporting actions that build on it.
Next Month Actions Template
Action 1: [Specific Task]
What: [Exact deliverable]
Why: [Data that supports this priority]
Expected impact: [Measurable outcome in next report]
Action 2: [Specific Task]
What: [Exact deliverable]
Why: [Data that supports this priority]
Expected impact: [Measurable outcome in next report]
Action 3: [Specific Task] (Optional)
What: [Exact deliverable]
Why: [Data that supports this priority]
Expected impact: [Measurable outcome in next report]
Pro Tip
Connect each action to specific data from earlier report sections. 'We're prioritizing Perplexity optimization because our ChatGPT citation rate (28%) is strong but Perplexity (12%) trails competitors.' This shows clients that strategy flows from analysis, not guesswork.
Reporting Cadence and Delivery
Consistent timing builds trust. Clients should know exactly when to expect reports and what format they'll arrive in. Set expectations in your engagement kick-off and never miss a deadline.
How to Use This Schedule: Share this timeline with clients during onboarding. It sets expectations for when they'll see each deliverable. Add these dates to your calendar on Day 1 of every engagement-missed deadlines erode trust faster than mediocre results.
Recommended Reporting Schedule
Day 10
First Artifact
Baseline audit and initial citation map delivered
Day 30
First Monthly Report
Full report structure with baseline metrics
Day 45
Executive Readout
First presentation to stakeholders with initial insights
Monthly
Ongoing Reports
Delivered by 5th business day of each month
Quarterly
Strategic Review
ROI assessment and strategy refinement (45-60 minute call)
How to Read This Scorecard: Each format is rated 1-5 for fit with each audience type. 5 = excellent fit (they'll actually read it), 1 = poor fit (it won't land). Match your delivery format to who's receiving it-executives need quick summaries, day-to-day contacts want detail.
Report Format Fit by Audience
| Factor | Executives | Day-to-Day | Archival |
|---|---|---|---|
| PDF Report | ●●●●○ | ●●●●● | ●●●●● |
| Slides Deck | ●●●●● | ●●●○○ | ●●●○○ |
| Live Dashboard | ●●○○○ | ●●●●● | ●●○○○ |
| Email Summary | ●●●●● | ●●○○○ | ●○○○○ |
Pro Tip
Deliver the full report + a 3-bullet email summary. The summary catches executives who won't open the attachment; the full report satisfies those who want detail. Never make clients ask for more information-anticipate what they need.
Educating Stakeholders on GEO Metrics
Most stakeholders understand SEO metrics because they've seen ranking reports for years. GEO metrics are new territory. Your job isn't just reporting-it's teaching clients what these numbers mean and why they matter.
The GEO ROI Journey: Set expectations upfront about when results appear. GEO isn't instant-each phase builds on the previous one. Use these bars to show clients how far along the ROI curve they are, and what comes next.
Entity establishment, schema, content optimization. The groundwork that makes everything else possible.
Citation frequency improving, traffic starting. The first signs that the foundation is working.
Consistent visibility, measurable conversions. ROI becomes clearly positive and accelerating.
Authority established, competitive moat. Results compound-less effort, more impact.
Stakeholder Translation Cheat Sheet
GEO Term
- Citation Frequency
- Share of AI Voice
- Brand Visibility Score
- Content Prominence
- AI Referral Traffic
Stakeholder Translation
- "How often AI mentions us"
- "Our market share in AI search"
- "How visible we are to AI users"
- "How prominently we're featured"
- "Visitors who found us through AI"
"The first three months of GEO engagement are education months. You're not just delivering results-you're building client understanding of a completely new performance channel."
FAQ
How long should a monthly GEO report be?
Should I include raw data or just summaries?
How do I report when results are flat or declining?
What tools do I need to create these reports?
How do I show ROI when GEO results take 6+ months?
Should I include competitor names in the report?
Ready to Report Like a Pro?
You now have the complete framework for GEO client reporting. Clear structure, stakeholder-friendly language, and templates that prove value.
Start with Section 1 (Executive Summary) next month. Build the habit, then expand sections as you refine your process.
Take the GEO Readiness Quiz →60 seconds · Personalized report · Free
Continue Learning
Dive deeper into AI search with these related articles:
Measuring GEO Success: Complete Analytics Framework
The definitive guide to GEO measurement. Track AI citations, measure Share of Voice, calculate ROI, and build dashboards that prove AI visibility impact.
The GEO Dashboard: What to Track and How to Report
Build a GEO dashboard that tracks citation frequency, brand visibility, share of voice, and AI referral traffic.
ROI of GEO: Calculating the Value of an AI Citation
Learn how to calculate the dollar value of AI citations. Practical ROI framework with formulas and benchmarks.