GEO & AI Search
The GEO Dashboard: What to Track and How to Report
Quick Answer
A GEO dashboard tracks 6 core metrics: citation frequency, brand visibility score, share of voice, AI referral traffic, content prominence, and sentiment. Track citation frequency and brand visibility weekly for priority queries, full audits monthly. Use GA4 for traffic data and a specialized GEO tool (Gauge, Otterly, or Conductor) for visibility data. Report to stakeholders monthly, framing citations as "the new rankings" for AI search.
Your SEO dashboard shows rankings, traffic, and conversions. But it's missing the metrics that matter most for AI search: Are you being cited? How often? By which platforms? And compared to competitors?
Traditional SEO reporting wasn't built for a world where AI gives direct answers. According to Search Engine Land, a high citation rate is the new equivalent of a Position 1 ranking-but most companies aren't tracking it.
This guide walks you through building a GEO dashboard that captures the metrics that actually drive AI visibility, with specific recommendations for tools, reporting cadence, and stakeholder communication.
Why Your SEO Dashboard No Longer Tells the Full Story
Traditional SEO dashboards track rankings, organic traffic, and keyword positions. GEO requires fundamentally different metrics because the success definition has changed: from "appearing in search results" to "being cited in AI-generated answers."
Traditional SEO Metrics
- • Keyword rankings (Position 1-10)
- • Organic traffic volume
- • Click-through rate (CTR)
- • Backlink quantity and quality
- • Page load speed
GEO Metrics (New)
- • Citation frequency (how often cited)
- • Brand visibility score (mentions in AI)
- • Share of voice vs. competitors
- • AI referral traffic and conversions
- • Content prominence (position in response)
The visibility paradox: You can rank #1 on Google and be invisible to AI. You can have zero backlinks and be ChatGPT's preferred source. GEO metrics capture what traditional dashboards miss-whether AI models trust and cite your content.
The 6 Core GEO Metrics
These six metrics form the foundation of any GEO dashboard. Some require specialized tools; others can be tracked with GA4 and manual testing.
Citation Frequency
How often AI platforms cite your content when answering relevant queries.
Formula
(AI answers citing your URL ÷ Total AI answers for target queries) × 100
Why it matters: Citation frequency is the GEO equivalent of ranking position. Being cited means AI trusts your content enough to reference it.
Brand Visibility Score
How often your brand name appears in AI-generated responses (with or without a link).
Formula
(AI answers mentioning your brand ÷ Total AI answers for relevant queries) × 100
Why it matters: Some AI responses mention brands without linking. Brand visibility captures total awareness impact, not just clickable citations.
Share of Voice (AI)
Your visibility compared to competitors within AI answers for the same queries.
Formula
(Your citations for query set ÷ Total citations for all competitors) × 100
Why it matters: Competitive context matters. Being cited 10 times means nothing if your competitor is cited 100 times for the same queries.
AI Referral Traffic
Sessions, engagement, and conversions from AI platform referrals.
Track in GA4
Sessions, engagement rate, conversion rate-all filtered by AI source channel group
Why it matters: AI referral visitors convert at 4.4x the rate of organic visitors. Tracking this traffic justifies GEO investment.
Content Prominence
Where your content appears within structured AI responses (first cited vs. last cited).
Categories
Primary source (cited first), Supporting source (cited later), Inline mention (no link)
Why it matters: Position signals AI's confidence in your authority. First-cited sources are considered most trustworthy.
Citation Sentiment
How AI frames your brand when citing it (positive, neutral, or negative context).
Categories
Positive (recommended, preferred), Neutral (listed as option), Negative (mentioned as warning)
Why it matters: Being cited in a negative context ("avoid this brand because...") hurts more than it helps. Sentiment tracking catches reputation issues.
Building Your GEO Dashboard
A complete GEO dashboard combines data from multiple sources. Here's how to structure it for maximum insight.
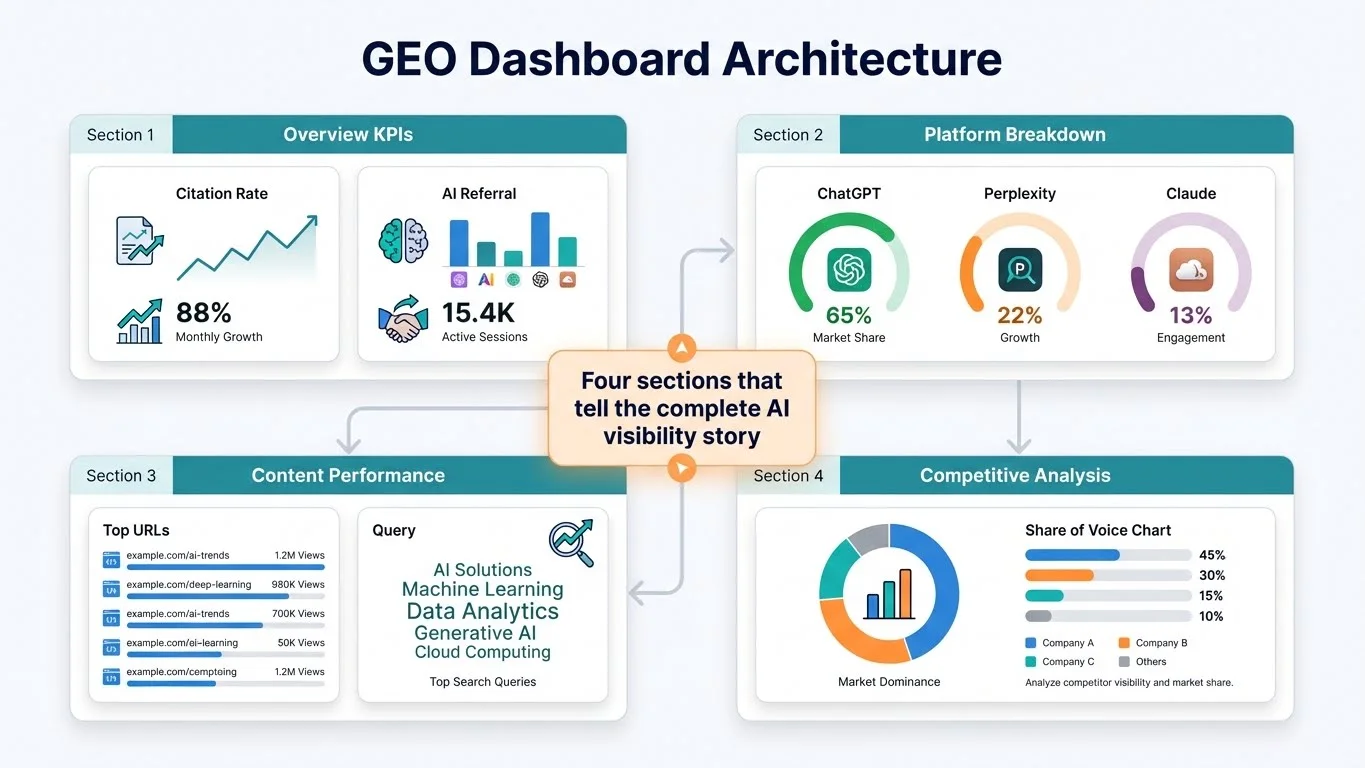
Dashboard Architecture
Section 1: Overview KPIs
At-a-glance metrics for stakeholders:
Citation Rate
Overall % and vs. last month
AI Referral Sessions
Total traffic from AI sources
Share of Voice
Your % vs. competitors
Section 2: Platform Breakdown
Performance by AI platform:
ChatGPT citations + traffic
Perplexity citations + traffic
Google AI Overviews appearances
Claude/Gemini/Copilot mentions
Section 3: Content Performance
Which content AI cites most:
- • Top 10 cited URLs
- • Queries where you're cited
- • Content gaps (competitor-cited but not you)
Section 4: Competitive Analysis
How you compare to competitors:
- • Share of voice by query category
- • Citation overlap (same queries)
- • Competitor citation sources (what AI cites them for)
A well-constructed dashboard doesn't just tell you whether you're cited-it contextualizes the citation. For each query, you should see whether the AI panel was triggered, which platforms cited you, how prominently you appeared, and whether those appearances correspond with traffic spikes.
Reporting Cadence: What to Track When
Not all metrics need daily monitoring. Here's a practical cadence that balances insight with time investment.
| Frequency | What to Track | Time Required |
|---|---|---|
| Weekly |
| 30-45 min |
| Monthly |
| 2-3 hours |
| Quarterly |
| Half day |
Stakeholder tip: Monthly reports work best for executive audiences. Include a summary section that translates GEO metrics into business impact: "Our AI visibility increased 23% this month, driving an additional 847 sessions that converted at 4.4x our organic rate."
Tools for GEO Tracking
Building a complete GEO dashboard typically requires combining multiple tools. Here's what each category provides:
Free / Built-In Tools
Google Analytics 4
AI referral traffic, conversions, engagement. Requires custom channel group setup.
Manual Testing
Query ChatGPT, Perplexity, Claude directly. Time-intensive but free.
Google Search Console
Limited-AI Overview traffic blended with organic. No separate filter available.
Specialized GEO Tools
Otterly.AI ($49/mo)
Citation tracking across 6 platforms, GEO auditing, 15K+ users.
Gauge
URL-level citation analytics, gap analysis, competitive intelligence.
Conductor (Enterprise)
End-to-end AEO/GEO platform with content creation integration.
Ahrefs Brand Radar
Brand mentions across AI Overviews, ChatGPT, Perplexity (mid-2025 launch).
For most teams, the combination of GA4 (traffic) + one specialized GEO tool (visibility) provides sufficient coverage. Start with the specialized tool's free trial to understand which features matter most before committing to annual pricing.
The 5 Dashboard Mistakes That Waste Your Time
Most teams build their first GEO dashboard wrong. Not because they're tracking the wrong metrics-the metrics above are correct-but because of how they implement the tracking. Here's what to avoid.
Mistake 1: Tracking Too Many Queries
Starting with 100+ queries means you never get deep insights on any of them. The teams that succeed start with 10-15 high-value queries, understand them completely, then expand. Quality of tracking beats quantity of tracking.
Mistake 2: Checking Manually Instead of Automating
Manual citation checks work for week one. By month two, you're tired of opening ChatGPT ten times a day. Build the automation upfront-either through a specialized tool or scheduled scripts-or the dashboard dies from neglect.
Mistake 3: Mixing Data Sources Without Normalization
GA4 reports sessions. Your GEO tool reports impressions. Neither uses the same time zones. Before comparing metrics, normalize them: same timeframes, same definitions, same date ranges. Otherwise you're comparing apples to mangoes.
Mistake 4: Reporting Metrics Without Context
"Our citation rate is 8%" means nothing. "Our citation rate is 8%, up from 3% last quarter, and 2x our main competitor" tells a story. Every metric needs a comparison-to your past, to your competitors, or to a meaningful benchmark.
Mistake 5: Building Dashboards Nobody Uses
The fanciest dashboard is worthless if it sits untouched. Before adding any metric, ask: "Who will look at this, and what decision will it inform?" If you can't answer both questions, don't track it.
The real lesson: The best GEO dashboard isn't the one with the most metrics. It's the one that gets looked at weekly and actually changes what you do. Start simple, prove value, then expand.
FAQ
Can I track GEO metrics in Google Analytics alone?
What's a good citation rate benchmark?
How often do I need to check AI visibility?
Should I report GEO metrics to stakeholders differently than SEO?
Ready to Build Your GEO Dashboard?
Tracking is step one. Calculating the ROI of your AI visibility is step two.
Learn how to assign dollar values to AI citations and justify GEO investment.
Take the GEO Readiness Quiz →60 seconds · Personalized report · Free
Continue Learning
Dive deeper into AI search with these related articles:
The New SEO Metrics That Matter in AI Search
Traditional SEO metrics are failing. Learn the new metrics that actually matter: AI Citation Frequency, Share of Model Visibility, and more.
AI Referral Traffic: Setting Up Tracking in Google Analytics
Learn how to track traffic from ChatGPT, Perplexity, Claude, and other AI tools in GA4.
AI Citation Frequency: What It Is and How to Track It
Citation frequency measures how often AI models reference your content. Learn what it is and how to track it.