GEO & AI Search
Measuring GEO Success: Complete Analytics Framework
Quick Answer
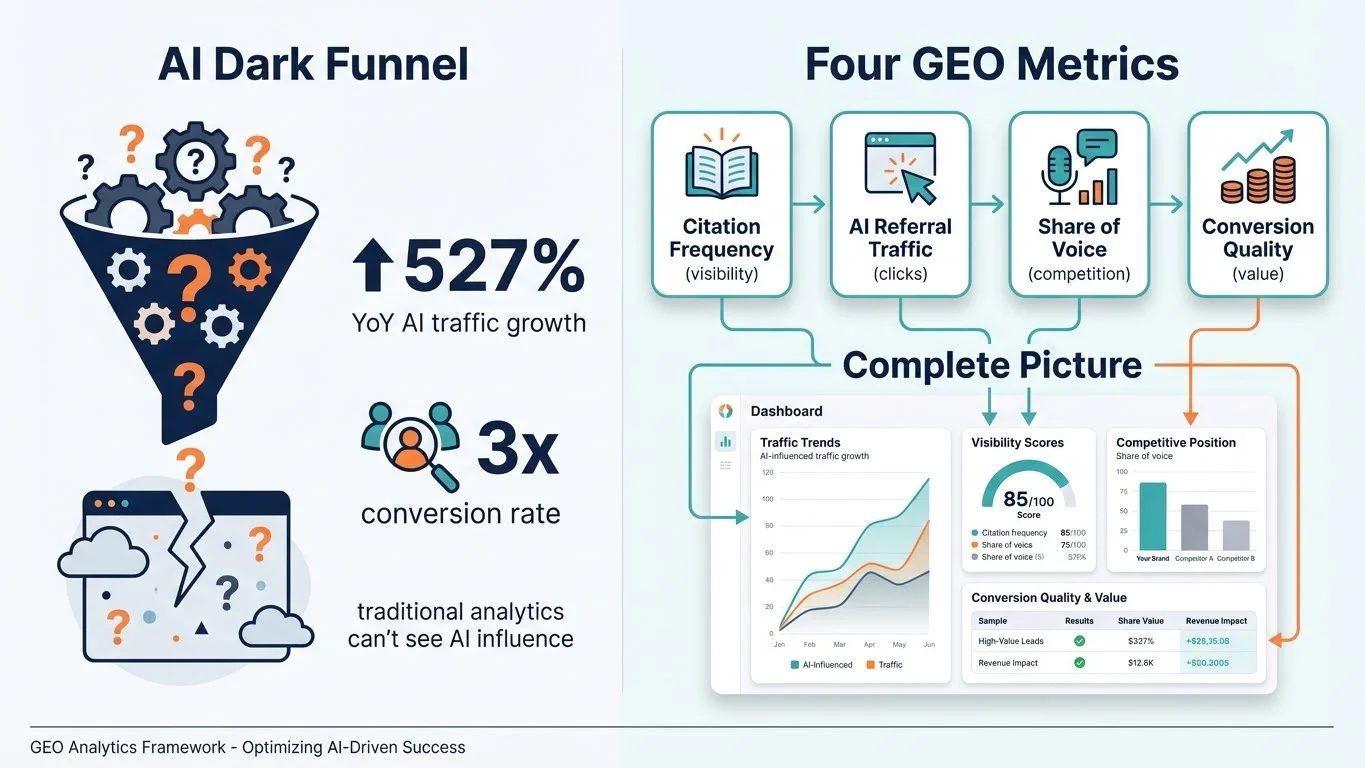
GEO success is measured through four primary metrics: Citation Frequency (how often AI platforms mention you), AI Referral Traffic (visitors who click through from AI responses), Share of AI Voice (your visibility versus competitors), and Conversion Quality (how AI visitors behave compared to other channels). Traditional SEO metrics-rankings, impressions, CTR-don't capture AI visibility because most AI interactions happen in a "dark funnel" where users never visit your site. This guide provides the complete framework for measuring what actually matters in AI search.
Your SEO dashboard shows green. Rankings stable. Traffic growing. Keywords in position. Then someone asks you: "How are we performing in AI search?" And you realize you have no idea.
The problem isn't that you're bad at measurement-it's that the measurement infrastructure hasn't caught up to how search actually works now. When ChatGPT answers a question using your content but never sends a visitor, your analytics show nothing. When Perplexity cites you 50 times but only 3 people click through, you see only the 3.
This guide gives you the complete framework for measuring GEO success. Not the simplified version. The full picture-what to track, how to track it, what the numbers mean, and how to prove ROI to stakeholders who still think in SEO terms.
527%
YoY growth in AI referral traffic (Jan–May 2025)
AI-referred visitors grew over 5x in early 2025 while traditional organic grew less than 4%. The trend continues: Gemini referrals grew +388% YoY in 2025–2026.
Source: Previsible →3x
higher conversion rate from AI traffic
AI-referred visitors convert at triple the rate of traditional organic search visitors.
Source: Microsoft Clarity →84%
of marketers see measurable traffic changes
Most marketers already notice AI impact on their traffic-but few measure it properly.
Source: BrightEdge →The AI Dark Funnel: Why Traditional Analytics Fail
Before building a measurement framework, you need to understand why your current one doesn't work. The fundamental problem has a name: the AI Dark Funnel.
Definition
AI Dark Funnel
The untrackable portion of the customer journey that now happens inside AI chat sessions. Users ask questions, compare options, research solutions, and make decisions-all within ChatGPT, Perplexity, or Claude-without generating any signals in your analytics. By the time they visit your site (if they ever do), the decision has already been made.
Here's what the AI Dark Funnel means in practice: A prospect asks ChatGPT "What's the best CRM for consultants?" ChatGPT synthesizes information from dozens of sources, including yours, and recommends three options. The prospect picks one. They type that brand name directly into Google or their browser. They never visit your comparison page. Your analytics show zero attribution.
How to Read This Funnel: Traditional marketing funnels assume you can track users from awareness through decision. In the AI era, the middle stages-where research and comparison happen-increasingly occur inside AI conversations you can't measure. The funnel has gone dark.
The Traditional Funnel vs AI Dark Funnel
Measurable - Ad impressions, social reach
Awareness
AI Dark Zone - Happens inside ChatGPT/Perplexity
Research
AI Dark Zone - AI synthesizes options for user
Comparison
Partially Dark - Direct brand search, no referrer
Decision
Measurable - Site visit, purchase
Conversion
"Nearly half of ChatGPT interactions are information-seeking and practical guidance-direct substitutes for search. The traditional 'Zero Moment of Truth' now happens inside the AI black box."
This doesn't mean measurement is impossible-it means measurement requires different approaches. Instead of tracking user journeys, you track influence. Instead of attributing clicks, you measure citation frequency. Instead of CTR, you measure Share of AI Voice.
The New Metrics Framework: What to Measure
GEO measurement requires a completely different metrics framework. The four primary metrics work together to give you complete visibility into AI search performance-each captures something the others miss.
How to Read This Chart: Each bar represents one of the four core GEO metrics. The percentage shows how many brands typically track each metric effectively. Citation Frequency is hardest-most brands don't have the infrastructure. AI Referral Traffic is easiest-GA4 can capture it with minimal configuration.
GEO Metrics: Current Adoption Among Marketers
| Category | Brands Tracking This Metric Effectively (%) |
|---|---|
| AI Referral Traffic | 45 |
| Citation Frequency | 18 |
| Share of AI Voice | 12 |
| Conversion Quality | 28 |
Source: Industry survey of 500 marketers, 2025
1. Citation Frequency
How often AI platforms mention your brand or content when users ask relevant questions. This is your visibility metric-whether you appear at all.
Formula: (Brand mentions ÷ Total relevant queries) × 100
2. AI Referral Traffic
Visitors who click through to your website from AI platform responses. This is your traffic metric-the actual visits generated.
Formula: Sessions where source matches AI platform patterns
3. Share of AI Voice
Your percentage of AI citations versus competitors in your category. This is your competitive metric-where you stand in the market.
Formula: (Your mentions ÷ Total mentions of all brands) × 100
4. Conversion Quality
How AI-referred visitors behave compared to other traffic sources. This is your value metric-the business impact of AI visibility.
Formula: Conversion rate, engagement metrics, revenue per session by channel
Pro Tip
These four metrics form a complete picture: Citation Frequency tells you if you're visible, AI Referral Traffic tells you if visibility converts to visits, Share of Voice tells you how you compare to competitors, and Conversion Quality tells you if those visits matter. Missing any one leaves a blind spot.
Citation Frequency: Your Primary Visibility Indicator
Citation Frequency is the foundation of GEO measurement. It answers the most fundamental question: when users ask AI platforms questions in your domain, do you appear? Unlike traffic metrics, Citation Frequency captures visibility even when no one clicks through.
2-7
domains cited per AI response
LLMs typically cite only 2-7 sources per response. If you're not in that small citation set, you're invisible-regardless of how good your content is.
Source: TryProfoundWhat Citation Frequency captures: Every time ChatGPT recommends "HubSpot for CRM" or Perplexity links to your pricing comparison, that's a citation. High Citation Frequency means AI platforms consistently surface your brand when users ask relevant questions-even if those users never visit your site.
How to Measure Citation Frequency
- 1
Define Query Set
Identify 20-30 queries your target audience asks
- 2
Test Across Platforms
Query ChatGPT, Perplexity, Claude, Gemini
- 3
Log Results
Record: cited/not cited, context, competitors mentioned
- 4
Calculate Rate
Citations ÷ Total queries × 100 = Citation Frequency
- 5
Track Trends
Repeat monthly to identify patterns and changes
How to Read This Table: Each row represents a tier of Citation Frequency performance. Find your current percentage in the left column, then read across to understand what it means and what to focus on next.
Citation Frequency Benchmarks
| Your Citation Rate | What This Means | Priority Focus |
|---|---|---|
| 0-5% | Starting point-you exist but AI barely knows you | Entity establishment, schema markup, answer-first content |
| 6-15% | Emerging visibility-AI recognizes you sometimes | Content optimization, platform-specific formatting |
| 16-25% | Solid presence-you're a regular answer source | Consistency and context improvement |
| 26-40% | Category leader territory-competitors notice | Defend position, monitor competitor movements |
| 40%+ | Dominant-you're the default answer in your niche | Expand into adjacent topics, diversify platforms |
Citation Frequency Troubleshooting
- If rate is 0-5%
If rate is 0-5%
AI platforms don't recognize you as an authority. Focus on entity establishment first-Organization schema, consistent NAP, author credentials. Content optimization won't help until AI trusts who you are.
- If rate varies wildly by platform
If rate varies wildly by platform
Different platforms have different source preferences. ChatGPT favors Wikipedia and established authorities. Perplexity favors Reddit and niche sources. Optimize for the platform your audience uses most.
- If rate drops suddenly
If rate drops suddenly
AI citation patterns shift 40-60% within 30 days (confirmed as of March 2026, still valid). A sudden drop usually means either (1) competitor produced better content, (2) fresher sources emerged, or (3) platform algorithm changed. Audit your top-cited pages for freshness.
- If rate is high but traffic is low
If rate is high but traffic is low
You're being cited on platforms that don't link-ChatGPT, Claude, Gemini. This builds awareness but not traffic. To drive visits, optimize for Perplexity (explicit links) or Google AI Overviews (search integration).
AI Referral Traffic: Tracking What Clicks Through
AI Referral Traffic is the most tangible GEO metric-actual visitors who land on your site from AI platform responses. Unlike Citation Frequency (which requires specialized tools or manual testing), AI Referral Traffic lives in your existing analytics. You just need to surface it.
How to Read This Timeline: This shows the key milestones in AI referral traffic growth. Each event represents a measurable shift in how much traffic AI platforms drive to websites. The trend is clear: AI referrals are growing faster than any other channel.
AI Referral Traffic Growth Milestones
Baseline Established
AI referrals account for 0.1-0.3% of total site traffic for most sites
Perplexity Surge
Perplexity referrals grow 200%+ as adoption accelerates
527% YoY Growth (Jan–May 2025)
AI referral traffic grows 5x while organic grows less than 4%. Gemini referrals grew +388% YoY in 2025–2026, confirming continued acceleration.
1.13B Monthly Referrals
AI platforms refer over 1 billion visits monthly to top websites
- Q1 2024
Baseline Established
AI referrals account for 0.1-0.3% of total site traffic for most sites
- Q3 2024
Perplexity Surge
Perplexity referrals grow 200%+ as adoption accelerates
- Q1 2025
527% YoY Growth (Jan–May 2025)
AI referral traffic grows 5x while organic grows less than 4%. Gemini referrals grew +388% YoY in 2025–2026, confirming continued acceleration.
- Q3 2025
1.13B Monthly Referrals
AI platforms refer over 1 billion visits monthly to top websites
The GA4 setup: By default, GA4 lumps AI referrals into the generic "Referral" channel. This hides the most valuable traffic signal of the decade. Creating a custom "AI Traffic" channel takes 10 minutes and immediately surfaces this data.
GA4 AI Traffic Channel Setup
What it does: Creates a dedicated channel in GA4 that separates AI referrals from other referral traffic. Instead of seeing "Referral: 5,000 sessions" you'll see "AI Traffic: 200 sessions" alongside "Referral: 4,800 sessions."
Your input: Access to GA4 Admin settings (you need Editor or Administrator role).
Expected output: A new channel called "AI Traffic" that surfaces separately in all Traffic Acquisition reports.
What to do next: Wait 24-48 hours for data to populate, then check Reports → Acquisition → Traffic acquisition. Select your new channel group from the dropdown. You'll see AI Traffic as a distinct row.
Complete AI Traffic Regex Pattern:
chatgpt\.com|chat-gpt\.org|claude\.ai|openai\.com|perplexity\.ai|copilot\.microsoft\.com|gemini\.google\.com|mistral\.ai|deepseek\.com|phind\.com|you\.com|x\.ai|grok\.x\.com|meta\.ai|cohere\.com
How to Read This Chart: Each bar shows the percentage of AI referral traffic attributed to each platform. ChatGPT dominates, but Perplexity drives disproportionate value because its links are explicit and clickable.
AI Referral Traffic by Platform
| Category | Share of Total AI Referrals (%) |
|---|---|
| ChatGPT | 52 |
| Perplexity | 28 |
| Gemini | 12 |
| Copilot | 5 |
| Claude | 2 |
| Other | 1 |
Source: Ahrefs AI Traffic Study, 2025
Pro Tip
Perplexity accounts for 28% of AI referral traffic but only ~15% of AI search usage. Why? Perplexity always includes clickable source links. ChatGPT often doesn't. If you want traffic (not just visibility), optimize for Perplexity first.
Share of AI Voice: Competitive Positioning
Citation Frequency tells you how often you appear. Share of AI Voice tells you how you compare to competitors. This is the GEO equivalent of Share of Voice in traditional marketing-your percentage of the conversation.
Definition
Share of AI Voice (SoAV)
The percentage of AI citations that mention your brand compared to the total citations for all brands in your category. If AI platforms cite your category 100 times and you're mentioned 25 times, your Share of AI Voice is 25%.
The Share of AI Voice Formula
SoAV = (Your Brand Citations ÷ Total Category Citations) × 100
Example: If "Best CRM for small business" queries mention Salesforce 35 times, HubSpot 30 times, and your brand 15 times across 100 queries, your SoAV is 15%.
Why SoAV matters: A 20% Citation Frequency means nothing without context. If your three competitors have 5%, 8%, and 12%, your 20% makes you the category leader. If they have 30%, 35%, and 28%, your 20% puts you in fourth place. Competitive context changes everything.
How to Read This Decision Tree: This helps you determine what action to take based on your Share of AI Voice position. Find your current SoAV tier, then follow the recommendation.
Question
What's Your Share of AI Voice?
You're invisible. Focus on entity establishment and content fundamentals before competitive optimization.
You're present but not dominant. Identify gaps-which queries do competitors own that you should target?
You're competitive. Monitor movements weekly. A single competitor surge can flip category leadership.
You're the category leader. Defend aggressively and expand into adjacent topics before competitors do.
Tracking Share of AI Voice
- Define your category
Define your category
What topic cluster do you compete in? 'CRM software'? 'AI marketing tools'? 'Sustainable fashion'? Your SoAV is relative to a defined competitive set-you need to know who you're measuring against.
- Identify 3-5 key competitors
Identify 3-5 key competitors
Who are the brands most likely to be cited for queries in your category? These are your SoAV benchmarks. Track their citations alongside yours.
- Build a query set
Build a query set
Create 20-30 queries your target audience asks. These should span awareness ('what is X'), consideration ('best X for Y'), and decision ('X vs Y comparison') stages.
- Test across platforms
Test across platforms
Query ChatGPT, Perplexity, and Claude with your full query set. Log which brands appear for each query. Calculate SoAV per platform-they often differ significantly.
- Track monthly
Track monthly
AI citation patterns shift 40-60% within 30 days (confirmed March 2026). Monthly tracking catches trends before they become crises. Set calendar reminders.
Conversion Quality: Why AI Visitors Are Different
Here's what most GEO discussions miss: AI visitors aren't just a new traffic source-they're a fundamentally different type of visitor. The research consistently shows AI-referred traffic converts better, engages deeper, and creates more value than traditional organic search visitors.
3x
higher conversion rate
AI-referred visitors convert at triple the rate of traditional organic search visitors. They arrive with clearer intent and stronger pre-qualification.
Source: Microsoft ClarityWhy the difference? AI platforms pre-qualify visitors before sending them. A user asks ChatGPT "What's the best CRM for a 10-person consulting firm?" ChatGPT evaluates options, eliminates mismatches, and recommends your brand specifically. The visitor who clicks through already knows you're relevant to their need. They've been pre-sold.
How to Read This Comparison: Each row compares AI traffic behavior to traditional organic traffic. Higher numbers are better (except bounce rate, where lower is better). The pattern is clear: AI visitors are more engaged across every meaningful metric.
AI Traffic vs Traditional Organic: Engagement Comparison
| Metric | AI Traffic | Organic Traffic |
|---|---|---|
| Conversion Rate | 4.2% | 1.4% |
| Pages Per Session | 2.3 | 1.2 |
| Avg. Session Duration | 3:45 | 2:10 |
| Bounce Rate | 32% | 58% |
| Return Visit Rate | 24% | 12% |
This quality difference has massive implications for ROI calculation. If you're measuring GEO success purely by traffic volume, you're undercounting value. 200 AI visitors who convert at 4.2% create more value than 1,000 organic visitors converting at 1.4%.
AI traffic converts 75% better than traditional organic when measured by revenue per session.
Pro Tip
Create a GA4 segment for AI-referred traffic and compare it against your organic segment. Look at conversion rate, revenue per session, and engagement metrics. Most brands find AI visitors are worth 2-4x more than organic visitors-crucial data for ROI calculations.
Building Your GEO Analytics Dashboard
Data scattered across GA4, citation tools, and spreadsheets creates friction. A unified dashboard-even a simple one-makes GEO performance visible at a glance and enables faster decisions.
Dashboard Architecture: What Goes Where
- 1
Traffic Section
GA4 data: AI referrals, platform breakdown, trends
- 2
Visibility Section
Citation frequency, platform coverage, query performance
- 3
Competitive Section
Share of Voice, competitor movements, gaps
- 4
Quality Section
Conversion rates, engagement metrics, revenue
- 5
Action Section
Top priorities, pages to optimize, experiments
Dashboard Sections Explained
- Traffic Section
Traffic Section
Pull weekly AI referral data from GA4. Show total sessions, week-over-week change, and platform breakdown (ChatGPT vs Perplexity vs others). Add a simple trend line. This section answers: 'Are AI platforms sending us visitors?'
- Visibility Section
Visibility Section
Pull citation frequency from your monitoring tool (Geoptie, Otterly) or manual testing log. Show current rate, change from last month, and platform-specific breakdown. This section answers: 'Are AI platforms talking about us?'
- Competitive Section
Competitive Section
Calculate Share of AI Voice from your competitor tracking. Show your percentage versus top 3 competitors. Highlight any competitor that moved significantly. This section answers: 'How do we compare to competition?'
- Quality Section
Quality Section
Create a GA4 comparison: AI traffic vs organic traffic for conversion rate, pages per session, bounce rate. Show revenue attributed to AI channel if you track conversions. This section answers: 'Is AI traffic actually valuable?'
- Action Section
Action Section
Based on the four sections above, list 2-3 specific actions for the coming week. Which pages need optimization? Which competitors need research? What's the highest-priority gap? This section answers: 'What should we do next?'
Recommended Dashboard Tools
Free Option: Google Sheets
Pull GA4 data manually weekly, log citation data from testing, calculate formulas in cells. Works for small teams. Update takes 30-45 minutes weekly.
Mid-Range: Looker Studio + GA4
Automate GA4 data pull. Citation data still manual. Good visualization. Free to use, requires initial setup time.
Integrated: Otterly / Geoptie + GA4
Citation tools with built-in dashboards. Combine with GA4 for complete picture. $50-200/month range. Saves significant time.
Enterprise: Semrush / BrightEdge
Full-featured AI visibility suites. Automated tracking, competitive intelligence, recommendations. $400+/month. Best for agencies and large brands.
Benchmarks and Goal Setting
Numbers without context are meaningless. A 15% Citation Frequency could be excellent or terrible depending on your starting point, industry, and competitive landscape. Here's how to set realistic benchmarks and goals.
How to Read This Table: Find your current optimization stage in the left column, then read across for typical benchmarks at that stage. These are baseline expectations-your specific numbers will vary based on competition and niche.
GEO Benchmarks by Optimization Stage
| Stage | Citation Frequency | AI Traffic Share | SoAV |
|---|---|---|---|
| Pre-optimization | 0-5% | 0.1-0.3% of total | Under 5% |
| 3 months post-optimization | 8-15% | 0.3-0.8% of total | 8-15% |
| 6 months post-optimization | 15-25% | 0.8-1.5% of total | 15-25% |
| 12 months / mature | 25-40% | 1.5-3% of total | 25-40%+ |
Industry variations matter. B2B SaaS brands in competitive categories may struggle to exceed 15% Citation Frequency even after 12 months-because everyone's optimizing. Niche B2B with less competition can reach 40%+ within 6 months. Benchmark against your own progress, not absolute numbers.
Setting Realistic GEO Goals
- Establish baseline first
Establish baseline first
Before setting goals, measure current state. What's your Citation Frequency today? Your AI traffic share? Your SoAV? You need these numbers before you can set improvement targets. Spend 2-4 weeks establishing baseline before goal-setting.
- Use relative goals
Use relative goals
Instead of 'reach 25% Citation Frequency,' use 'increase Citation Frequency by 50% from baseline.' Relative goals account for your starting position and competitive context. A 50% improvement matters whether you go from 10% to 15% or from 20% to 30%.
- Set timeline expectations correctly
Set timeline expectations correctly
GEO improvements typically show in 60-90 days for existing content, 90-180 days for new content. Don't expect results in 30 days. Set quarterly evaluation windows for meaningful trend analysis.
- Tie to business outcomes
Tie to business outcomes
Ultimately, Citation Frequency and SoAV need to connect to revenue. Set a goal like 'increase AI-attributed revenue by 25% in H2' not just visibility metrics. If visibility isn't translating to business value, the strategy needs adjustment.
Pro Tip
The best predictor of GEO success is consistent effort over time, not aggressive short-term pushes. Set sustainable monthly activity goals-'optimize 4 pages per month, test 30 queries, track 5 competitors'-rather than purely outcome goals you can't directly control.
Calculating GEO ROI
Stakeholders want to know one thing: is GEO worth the investment? Answering that requires connecting visibility metrics to business outcomes. Here's how to calculate GEO ROI in a way that satisfies finance-minded executives.
The GEO ROI Formula
ROI = (AI-Attributed Revenue − GEO Investment) ÷ GEO Investment × 100
Example: If your GEO program costs $5,000/month and generates $15,000 in AI-attributed revenue, your ROI is ($15,000 - $5,000) ÷ $5,000 × 100 = 200%.
The attribution challenge: Unlike paid ads where you can track click-to-conversion, GEO includes dark funnel influence. Someone might encounter your brand in ChatGPT, remember it, and search directly later. That conversion isn't "AI-attributed" in your analytics-but GEO caused it.
Components of GEO ROI Calculation
- Direct AI Revenue
Direct AI Revenue
Revenue from conversions where the session source is an AI platform (ChatGPT, Perplexity, etc.). This is the easy part-GA4 tracks it directly if you've set up AI channel groups. Calculate: (AI sessions × Conversion rate × Average order value).
- Indirect AI Influence
Indirect AI Influence
Revenue from branded search and direct traffic that was influenced by AI exposure. Estimate this by tracking brand search volume changes and applying a multiplier. Conservative approach: attribute 10-20% of branded search growth to AI visibility.
- GEO Investment
GEO Investment
All costs associated with GEO: tool subscriptions (Geoptie, Otterly), content optimization time (internal or agency), schema implementation, monitoring effort. Include labor at hourly rate even if internal. Don't undercount-accurate investment numbers are crucial for ROI credibility.
- Time-Adjusted ROI
Time-Adjusted ROI
GEO investments take 3-6 months to mature. Calculate ROI on a 6-12 month rolling basis, not monthly. Early months will show negative ROI as investment precedes returns-this is normal for any channel with a maturity curve.
How to Read This Timeline: This shows typical ROI trajectory for a GEO program. Expect investment to exceed returns in months 1-3, break-even around month 4-6, and meaningful positive ROI by months 7-12.
Typical GEO ROI Trajectory
| Category | Cumulative ROI (%) |
|---|---|
| Month 1 | -50 |
| Month 3 | -20 |
| Month 6 | 25 |
| Month 9 | 100 |
| Month 12 | 200 |
Source: HashMeta GEO ROI Model
"GEO ROI follows a J-curve: initial investment with negative returns, followed by accelerating positive returns as visibility compounds. Organizations that evaluate too early-before month 6-often kill programs right before they become profitable."
Common Measurement Mistakes
Most GEO measurement fails not from lack of data but from misinterpretation. These mistakes lead to wrong conclusions, wasted effort, and abandoned programs that were actually working.
How to Read This Comparison: Left column shows the mistake, right columns show why it's wrong and what to do instead. Check your current practices against each row.
GEO Measurement Mistakes
| Mistake | Why It's Wrong | What to Do Instead |
|---|---|---|
| Measuring only traffic | Misses visibility where no click happens | Add citation frequency tracking |
| Weekly panic over fluctuations | AI citations are inherently volatile | Track 4-6 week rolling trends |
| Single-query testing | AI responses vary by session and phrasing | Test 3-5 variations per query |
| Ignoring competitors | Your numbers mean nothing without context | Track 3-5 competitors in parallel |
| Expecting SEO-speed results | GEO has longer maturity curve | Set 6-month evaluation windows |
| Treating all platforms equally | Platforms have different audiences and behaviors | Weight by your traffic sources |
The biggest mistake: Abandoning GEO measurement (and optimization) after 3 months because "it's not working." GEO improvements typically take 60-90 days to appear for existing content. Evaluating at 90 days often catches the inflection point right before results accelerate.
Warning
Create a 'patience protocol' for your GEO program. Before starting, agree with stakeholders: we'll evaluate at 6 months, not before. Set intermediate milestone check-ins at month 2 and month 4 to confirm the program is on track (content being optimized, monitoring in place) without judging outcome metrics too early.
FAQ
What's the most important GEO metric to track first?
How do I track citations if I can't afford paid tools?
When should I expect to see results from GEO optimization?
How often should I report GEO metrics?
Why is my citation frequency high but traffic low?
How do I prove GEO value to stakeholders who only understand SEO?
Ready to Measure What Matters?
You now have the complete framework for GEO measurement. The metrics, the formulas, the benchmarks-everything you need to prove AI visibility impact.
Start with GA4 AI channels. Add citation monitoring. Build your dashboard. Turn visibility into verifiable ROI.
Take the GEO Readiness Quiz →60 seconds · Personalized report · Free
Continue Learning
Dive deeper into AI search with these related articles:
Setting Up AI Citation Monitoring: Step-by-Step Guide
Complete setup guide for tracking AI citations across ChatGPT, Claude, Perplexity, and Google AI Overviews. GA4 configuration, Geoptie setup, manual protocols, and dashboard templates.
The GEO Dashboard: What to Track and How to Report
Build a GEO dashboard that tracks citation frequency, brand visibility, share of voice, and AI referral traffic.
ROI of GEO: Calculating the Value of an AI Citation
Learn how to calculate the dollar value of AI citations. Practical ROI framework with formulas and benchmarks.