GEO & AI Search
Setting Up AI Citation Monitoring: Step-by-Step Guide
Quick Answer
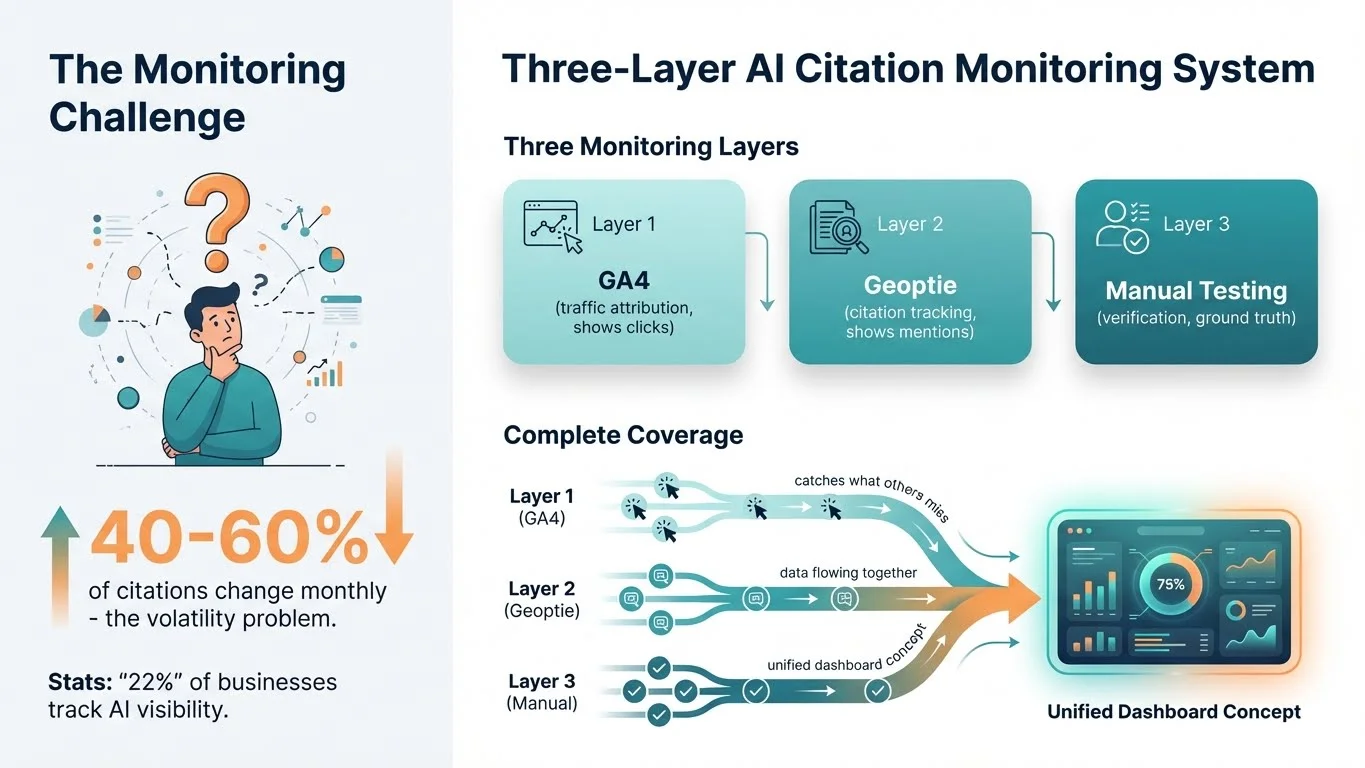
AI citation monitoring requires three layers: traffic attribution (GA4), visibility tracking (Geoptie or similar), and manual verification testing. GA4 custom channels take 10 minutes to configure. Geoptie's free beta provides automated citation tracking across 5 platforms. Manual testing-15 minutes weekly-validates what automated tools report. This guide provides exact steps for each layer, plus a dashboard template to unify the data.
You optimized your content for AI citations. Added answer capsules. Implemented schema markup. Built author authority signals. Now what? Without monitoring, you're optimizing blind-no feedback loop, no evidence of progress, no idea what's working.
AI citation monitoring isn't a nice-to-have. It's the feedback mechanism that tells you whether optimization efforts translate to visibility. Traditional SEO has Google Search Console and rank trackers. GEO needs equivalent infrastructure-and building it takes less time than most people assume.
This guide walks through complete setup: GA4 configuration for AI traffic attribution, Geoptie onboarding for citation tracking, manual testing protocols for verification, and a dashboard template to unify everything. By the end, you'll have a functional monitoring system running.
40-60%
of AI citations change within 30 days
Citation patterns shift rapidly-monthly monitoring is minimum.
Source: TryProfound →73%
of AI users take action within 24 hours
Citations convert quickly-visibility tracking reveals revenue impact.
Source: Superprompt →22%
of businesses actively track AI visibility
Early movers have competitive intelligence advantage.
Source: Birdeye →What to Monitor: The Three Citation Metrics
Before configuring tools, understand what you're measuring. AI citation monitoring tracks three distinct metrics-each requires different tools and provides different insights.
Definition
AI Citation Frequency
How often your brand or content is mentioned when users query AI platforms about topics in your expertise. Measured as percentage of relevant queries where you appear.
Definition
AI Referral Traffic
Visitors who click through to your website from AI-generated responses. Tracked via GA4 referral source data. Represents actual site impact, not just visibility.
Definition
Citation Context
How you're mentioned: positive recommendation, neutral reference, or comparative mention. Same citation frequency with different context has vastly different business impact.
How to Read This Chart: Each bar shows what percentage of brands typically achieve each type of metric. "Citation Frequency" has the highest achievability-most brands can get some level of AI mentions. "Positive Context" is hardest-appearing favorably requires strong authority signals.
GEO Metric Achievement Rates
| Category | Brands Achieving This Metric (%) |
|---|---|
| Any Citation Frequency | 65 |
| Measurable AI Traffic | 45 |
| Positive Citation Context | 30 |
| Competitive Visibility | 20 |
Source: Industry analysis of 200 brands
"Success in GEO is measured by an increase in AI citations, improved brand accuracy in answers, and more traffic from content that's being quoted."
GA4 AI Traffic Tracking: Complete Setup
GA4 already captures AI referral data-it's hidden in the generic "Referral" channel. This setup surfaces AI traffic into a dedicated channel, giving you clear visibility into how many visitors come from ChatGPT, Perplexity, Claude, and other AI platforms.
GA4 AI Channel Setup (10 Minutes)
- 1
Access Channel Groups
Admin → Data Display → Channel Groups
- 2
Create New Group
Click 'Create channel group', name it 'With AI Traffic'
- 3
Add AI Channel
Click 'Add new channel', name it 'AI Traffic'
- 4
Set Condition
Source → Matches regex → paste pattern below
- 5
Position Correctly
Drag 'AI Traffic' ABOVE 'Referral' in the channel list
- 6
Save & Verify
Save group, wait 24-48 hours, check Traffic Acquisition report
Copy this pattern: This comprehensive regex captures all major AI platforms. Paste it directly into the GA4 Source regex field-no modifications needed.
Complete AI Traffic Regex Pattern:
chatgpt\.com|chat-gpt\.org|claude\.ai|openai\.com|perplexity\.ai|copilot\.microsoft\.com|gemini\.google\.com|mistral\.ai|deepseek\.com|phind\.com|you\.com|x\.ai|grok\.x\.com|meta\.ai|cohere\.com
Warning
Position is critical. GA4 assigns traffic to the first matching channel. If 'AI Traffic' sits below 'Referral', AI visits get absorbed into referrals and never surface. Always drag your AI channel ABOVE Referral in the list.
Verification step: After 24-48 hours, navigate to Reports → Acquisition → Traffic acquisition. Change the primary dimension to "Session default channel group (with AI Traffic)". You should see "AI Traffic" as a distinct row if any AI platforms have referred visitors.
If AI traffic isn't appearing after 48 hours, something went wrong during setup. Work through these five checks in order. The most common problem is channel position-GA4 assigns traffic to the first matching rule, so if Referral sits above your AI Traffic channel, AI visits get absorbed into Referral and never surface separately.
GA4 Troubleshooting Checklist
- Check 1
Channel position
Go back to Admin → Data Display → Channel Groups. Find your custom group. Look at the channel list. Is 'AI Traffic' positioned ABOVE 'Referral'? If not, drag it up. This single issue causes 80% of 'my AI traffic isn't showing' problems.
- Check 2
Regex syntax
Copy the regex pattern from this guide again. Paste it fresh. Leading spaces, trailing spaces, or invisible characters break the pattern. When in doubt, delete the old pattern and paste clean.
- Check 3
Processing time
GA4 data isn't real-time. After making changes, wait 24-48 hours before checking results. If you just set this up today, come back tomorrow.
- Check 4
Traffic volume
Do you actually have AI visitors? If your site is new or gets minimal traffic, there may not be enough AI-referred visits to surface yet. Check weekly-even a few visits will appear once accumulated.
- Check 5
Report configuration
When viewing Traffic Acquisition reports, you must explicitly select your custom channel group from the dropdown. GA4 defaults to the standard channel group. If you're looking at the wrong group, your AI Traffic channel won't appear-not because it failed, but because you're looking in the wrong place.
Geoptie Citation Monitoring: Step-by-Step
Geoptie provides citation tracking across ChatGPT, Claude, Gemini, Perplexity, and Bing Chat-all in one dashboard. During their open beta, it's completely free. Here's how to set it up.
Key Insight: This describes why Geoptie works differently than GA4-it tracks visibility (whether you're mentioned), not just traffic (whether they clicked through).
5
AI platforms monitored simultaneously
Geoptie tracks ChatGPT, Claude, Gemini, Perplexity, and Bing Chat in one view-no platform-hopping required.
Source: Search Engine LandGeoptie Onboarding (15 Minutes)
- 1
Create Account
Visit geoptie.com/app, sign up with email
- 2
Add Your Brand
Enter brand name, domain, and category
- 3
Discover Competitors
Geoptie auto-suggests competitors; add 3-5 relevant ones
- 4
Run First Audit
Execute GEO audit on your homepage or key landing page
- 5
Set Up Prompts
Add 10-20 target keywords for ongoing monitoring
- 6
Explore Dashboard
Review citation analytics, competitor comparisons, prompt tracking
How to Read This Comparison: The left column shows what Geoptie tracks (visibility and citations). The right shows what GA4 tracks (traffic and conversions). You need both-Geoptie answers "are we mentioned?", GA4 answers "did it drive visits?"
Geoptie vs GA4: Complementary Functions
| Metric | Geoptie | GA4 |
|---|---|---|
| Citation detection | ✓ Primary function | ✗ Not available |
| Platform coverage | 5 AI platforms | All web referrers |
| Traffic attribution | Limited | ✓ Primary function |
| Competitor visibility | ✓ Built-in | ✗ Not available |
| Click-through tracking | ✗ Not available | ✓ Full path data |
| Cost | Free (beta) | Free |
Manual Citation Testing: The 15-Minute Weekly Protocol
Automated tools are convenient. But they can miss citations, misreport context, or lag behind platform updates. Manual testing-15 minutes weekly-provides ground-truth verification that keeps your monitoring honest.
Weekly Manual Citation Test Protocol
- 1
Select Keywords
Pick 5-10 target keywords. Rotate weekly to cover full topic set monthly.
- 2
Query ChatGPT
Test each keyword. Note: cited / not cited / competitor cited instead.
- 3
Query Perplexity
Same keywords. Compare citation patterns across platforms.
- 4
Query Claude
Same keywords. Note platform-specific differences.
- 5
Document Results
Log in spreadsheet: date, keyword, platform, result, context.
Copy this tracking template: Use this format for your manual testing spreadsheet. Each row = one keyword tested on one platform on one date.
Manual Testing Spreadsheet Columns:
Date | Keyword | Platform | Cited? | Citation Context | Competitors Mentioned | Notes
Pro Tip
Vary your query phrasing. AI platforms respond differently to 'What is X?' versus 'How does X work?' versus 'Best X for Y.' Test multiple phrasings per keyword to understand citation triggers.
Why manual matters: In October 2024, a major GEO tool showed one brand as "never cited" for a target keyword. Manual testing revealed they were cited 40% of the time-the tool was querying with different phrasing. Always verify.
Building Your GEO Dashboard
Data lives in multiple places: GA4 for traffic, Geoptie for citations, spreadsheets for manual tests. A unified dashboard-even a simple one-brings it together for decision-making.
Your dashboard doesn't need to be fancy. A simple Google Sheet with six sections works fine. The goal is having one place where you can see all your GEO data at a glance, instead of logging into three different tools every time you want to check performance.
Dashboard Section Guide
- Section 1
AI Traffic This Week
Pull this from GA4's custom channel group. Write down total AI-referred sessions and compare to last week. Is it up, down, or flat? This tells you whether AI platforms are sending more or fewer visitors to your site.
- Section 2
Citation Frequency
Pull this from Geoptie's brand monitoring dashboard. What percentage of your tracked keywords result in your brand being mentioned? 10%? 25%? 40%? This tells you how visible you are in AI responses-not whether they click through, just whether you're mentioned at all.
- Section 3
Platform Breakdown
Which AI platform is driving the most traffic? Check GA4 for referrer breakdown (perplexity.ai vs chatgpt.com vs claude.ai). Also check Geoptie for citation breakdown by platform. You may find you're cited often on Perplexity but rarely on ChatGPT-that insight guides where to focus optimization.
- Section 4
Competitor Watch
Who showed up where you didn't? When you run manual tests or review Geoptie's competitor data, note which competitors are getting cited for keywords you're targeting. If the same competitor keeps appearing, study what they're doing differently.
- Section 5
Top Performing Pages
Which pages on your site are actually getting cited? Geoptie shows this. Some pages may drive 80% of your citations while others contribute nothing. Focus optimization efforts on replicating what works.
- Section 6
Manual Test Summary
Reserve space to record weekly manual test results-the keywords you tested, whether you appeared, and any notable observations. This ground-truth data validates what the automated tools report.
How to Read This Table: Each row shows a reporting cadence (weekly/monthly/quarterly) and what to report at that frequency. Weekly is operational. Monthly is tactical. Quarterly is strategic.
GEO Reporting Cadence
| Frequency | What to Report | Decision It Informs |
|---|---|---|
| Weekly | AI traffic trend, new citations, manual test results | Immediate optimization priorities |
| Monthly | Citation share change, competitor movements, page performance | Content strategy adjustments |
| Quarterly | Overall GEO ROI, platform mix shifts, capability gaps | Tool investment, team training, strategy pivots |
Interpreting Your Citation Data
Raw numbers mean nothing without interpretation. A 15% citation frequency could be excellent or concerning-context determines which. Here's how to read your monitoring data and know whether you're on track.
How to Read This Table: This benchmark reference helps you interpret your citation frequency. Find your current percentage in the left column, then read across for what it typically indicates.
Citation Frequency Benchmarks
| Your Citation Rate | What This Indicates | Typical Next Action |
|---|---|---|
| 0-5% | Starting point for most brands. You exist but aren't prominent. | Focus on content structure, schema markup, authority signals. |
| 6-15% | Progress visible. AI platforms recognize you. | Identify which content types drive citations, double down. |
| 16-25% | Strong presence. You're a regular answer source. | Optimize citation context-ensure mentions are positive. |
| 26-40% | Category leader territory. Competitors notice. | Maintain and defend; monitor competitor movements. |
| 40%+ | Dominant position in your niche. | Diversify queries-expand into adjacent topics. |
Good signals: Upward trend over 4-6 weeks, consistent presence across multiple platforms, positive citation context (recommended, cited as source, mentioned alongside credible competitors), increasing click-through from AI referrals in GA4.
Warning signs: Citation frequency dropping while traffic stays flat (AI is citing but not linking), appearing only on one platform (over-optimization for single source), negative context (mentioned as cautionary example or outdated reference), competitors gaining while you're static.
Warning
Citation context matters more than frequency. Being cited in 10% of queries with positive recommendations beats 30% citation as a 'what not to do' example. Always read HOW you're mentioned, not just whether you appear.
Platform-Specific Monitoring Nuances
ChatGPT, Perplexity, and Claude don't behave identically. Each has distinct citation patterns, update frequencies, and ranking factors. Effective monitoring accounts for these differences rather than treating all platforms as interchangeable.
How to Read This Comparison: Each column represents a major AI platform. Rows show how each platform handles citations differently-this affects how you monitor and optimize for each.
AI Platform Citation Behaviors
| Behavior | ChatGPT | Perplexity | Claude |
|---|---|---|---|
| Citation style | Synthesizes without always naming sources | Explicitly cites with numbered references | Conversational with occasional source mentions |
| Update frequency | Training cutoff + browsing (Plus) | Real-time web search | Training cutoff, no live browsing |
| Link behavior | Rarely provides clickable links | Always includes clickable source links | No external links in responses |
| Verification method | Manual query testing | Check numbered citations | Manual query testing |
| Traffic potential | Lower (no links) | Highest (explicit links) | Lowest (no links) |
Perplexity monitoring focus: Track which of your pages appear in numbered citations. Perplexity's explicit source attribution makes this the easiest platform to monitor-you can see exactly which URLs are cited and click through to verify. Prioritize Perplexity if you need quick wins and measurable referral traffic.
ChatGPT monitoring focus: Pay attention to brand mentions rather than link citations. ChatGPT often synthesizes information without explicit source attribution, so track whether your brand name, author name, or unique methodology is mentioned. This influences brand awareness more than direct traffic.
Claude monitoring focus: Look for conceptual influence. Claude frequently uses training data without real-time web access, so appearing in Claude responses means your content has been incorporated into its knowledge base. This is a lagging indicator-content that works in Claude was likely published months ago.
Pro Tip
Perplexity is the best platform for proving ROI because clicks are directly attributable. Use Perplexity performance to build the case for GEO investment, then expand monitoring to ChatGPT and Claude.
The Optimization Feedback Loop
Monitoring without action is just watching numbers move. The real value of citation tracking comes from the feedback loop: observe patterns, form hypotheses, optimize content, measure results, repeat. Here's how to operationalize that cycle.
GEO Optimization Cycle (Monthly)
- 1
Collect Data
Pull weekly reports into monthly summary: citation frequency, traffic, context
- 2
Identify Patterns
Which pages get cited? Which queries work? What context dominates?
- 3
Form Hypothesis
'Pages with FAQ sections get 2x citations' or 'How-to queries outperform what-is'
- 4
Prioritize Changes
Pick 2-3 pages to optimize based on hypothesis. Don't change everything.
- 5
Implement Updates
Add answer capsules, restructure content, update schema, refresh data
- 6
Measure Results
Track optimized pages for 4-6 weeks. Compare before/after citation rates.
Sample optimization triggers: If your monitoring shows strong citation frequency but low traffic, the issue is likely missing links-add clearer CTAs and ensure your content invites click-through. If you see traffic but declining citations, competitors may be producing fresher content-prioritize content updates. If one page significantly outperforms others, analyze what's different and replicate that pattern.
At the end of each month, spend 30-60 minutes reviewing your GEO performance and deciding what to optimize next. This isn't passive data collection-it's an active decision-making session. Block time on your calendar. Here's exactly what to do during that session:
Monthly Review Protocol
- 1
Compare this month's data to last month
Look at citation frequency, AI traffic, and platform breakdown. Did any metric change by more than 10%? Upward shifts mean something is working-dig into what. Downward shifts need investigation. Flat performance isn't necessarily bad; it means you're maintaining visibility while competitors may be losing ground.
- 2
Identify your top performing pages
Which 3-5 pages drove the most AI citations this month? Open them. Read them. What do they have in common? Answer capsules? Strong FAQ sections? Specific expertise signals? Document these patterns-they're your template for future content.
- 3
Audit your underperformers
Which pages should be getting cited but aren't? Compare them to your top performers. What's missing? Often it's structural: buried answers, vague claims, missing author credentials. Sometimes it's freshness: outdated statistics, old screenshots, stale examples. Make a list of specific fixes for each underperforming page.
- 4
Check competitor movements
Did any competitor appear more often this month? Did anyone new enter your space? Use Geoptie's competitor data or your manual test notes. If a competitor suddenly shows up everywhere, visit their site. What changed? New content? Different structure? Better expertise signals?
- 5
Set next month's priorities
Based on steps 1-4, pick 2-3 specific pages to optimize. Not 'improve overall GEO'-specific pages with specific fixes. Write them down. Schedule time to do the work. Without this step, the review becomes useless analysis that never translates to action.
Common Monitoring Mistakes to Avoid
Most GEO monitoring fails not from bad tools but from bad practices. These mistakes waste time, produce misleading data, and lead to wrong optimization decisions. Here's what to avoid.
How to Read This Table: Left column shows the mistake. Right column shows the correct approach. Check your current practices against each row.
Monitoring Mistakes vs Correct Approach
| Common Mistake | Why It's Problematic | Correct Approach |
|---|---|---|
| Checking once, drawing conclusions | AI responses vary by session, time, phrasing | Test same query 3-5 times across different days |
| Only monitoring your brand | No context for whether you're gaining or losing ground | Track 3-5 competitors alongside your brand |
| Ignoring citation context | Positive and negative mentions have opposite value | Log HOW you're mentioned, not just whether |
| Weekly panic over fluctuations | Short-term variance is noise, not signal | Look at 4-6 week trends, ignore daily swings |
| Trusting tools blindly | Automated tools miss citations, misreport context | Validate with manual testing weekly |
The biggest mistake of all: Treating citation monitoring as a passive dashboard rather than an active diagnostic tool. Data only matters when it drives decisions. If you're not changing anything based on what you see, you're not monitoring-you're just watching.
Pro Tip
Set up an 'action trigger' for every metric you track. Example: 'If citation frequency drops below 15% for two consecutive weeks, audit content freshness.' Without triggers, data becomes noise.
One more trap to avoid: optimizing for the wrong platform. Check where your audience actually comes from (GA4 referral data) before investing heavily in platform-specific optimization. If 80% of your AI traffic is from Perplexity, don't spend weeks optimizing for ChatGPT citation patterns. Follow the data, not assumptions about which platform "matters most."
FAQ
How often should I run citation monitoring?
Can I automate citation monitoring completely?
What's a good AI citation benchmark?
Should I monitor all AI platforms equally?
What if I'm never cited?
How do I track citations if I don't have budget for tools?
Ready to Start Monitoring?
You now have everything needed to track AI citations. The setup takes 30-45 minutes. The insights compound over weeks and months.
Start with GA4 custom channels. Add Geoptie. Run your first manual test. Document everything.
Take the GEO Readiness Quiz →60 seconds · Personalized report · Free
Continue Learning
Dive deeper into AI search with these related articles:
AI Citation Frequency: What It Is and How to Track It
Citation frequency measures how often AI models reference your content. Learn what it is and how to track it.
The GEO Dashboard: What to Track and How to Report
Build a GEO dashboard that tracks citation frequency, brand visibility, share of voice, and AI referral traffic.
Free GEO Tools: Building Your Stack Without Budget
Build a complete GEO monitoring stack without spending money. Free tools for AI citation tracking, traffic attribution, and content optimization—plus the GA4 setup most marketers miss.