GEO & AI Search
GEO Toolkit Category 3: Measurement and Reporting Prompts (Complete Collection)
Quick Answer
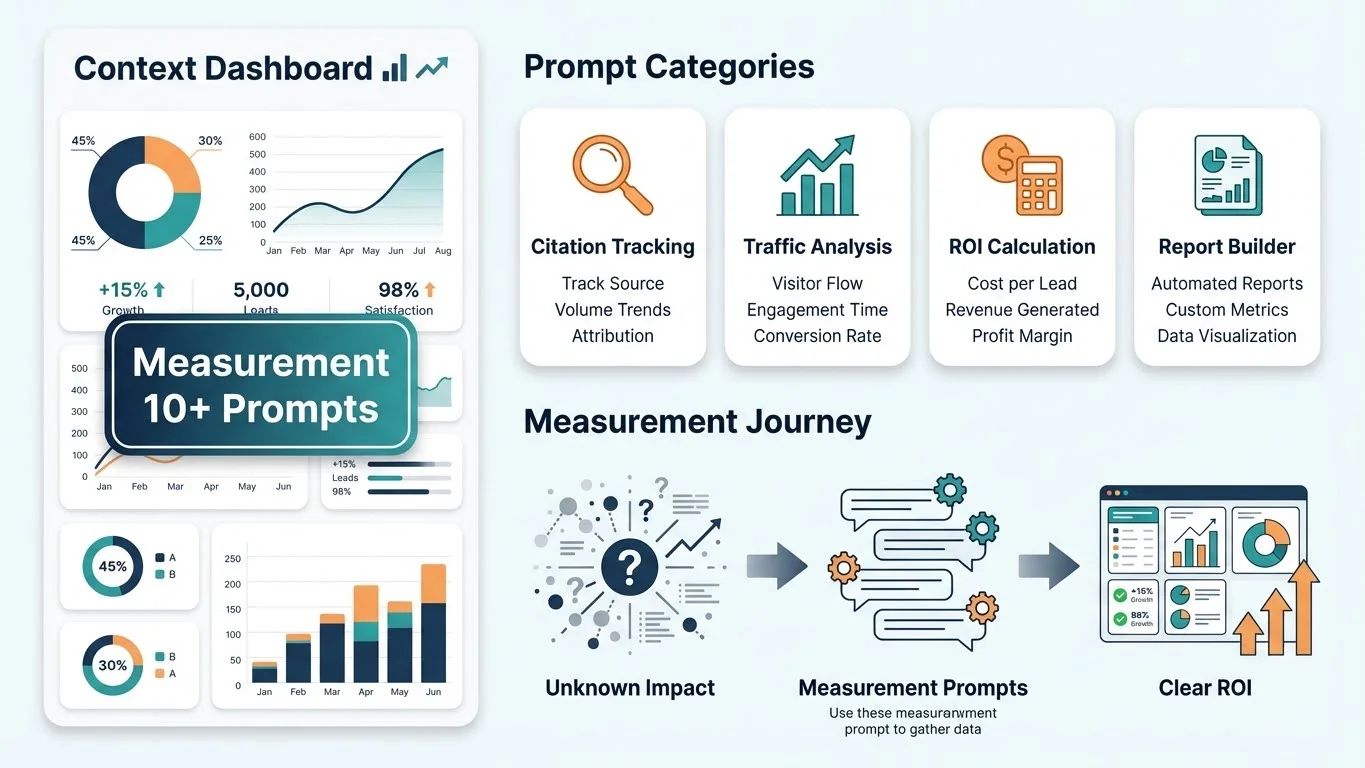
Measurement and Reporting prompts help you track AI visibility, establish baselines, monitor citation patterns, and build stakeholder reports. This category includes 10 prompts: AI Visibility Baseline Assessment, Citation Monitoring Protocol, Platform-Specific Tracking, Competitor Visibility Tracker, Monthly Progress Report Generator, Quarterly Review Builder, ROI Calculator, Stakeholder Presentation Builder, Anomaly Detection, and Opportunity Identifier. You can't improve what you don't measure-these prompts make GEO progress visible and provable.
The hardest question in GEO isn't "how do I optimize?"-it's "is it working?" Traditional SEO has rankings, traffic, and conversions. GEO has... what exactly? A gut feeling that you saw your brand mentioned in ChatGPT once?
Measurement is where most GEO efforts fail. Not because the optimization doesn't work, but because nobody set up tracking to prove it. Three months later, someone asks "what did we get from that GEO project?" and you're scrambling to show value.
These 10 prompts solve the measurement problem by creating systematic frameworks for visibility tracking, progress reporting, and stakeholder communication. Each produces structured outputs you can use immediately-spreadsheet formats, report templates, and analysis frameworks.
Why GEO Measurement Is Different
Traditional SEO measurement is automated-tools scrape rankings, analytics track traffic, and dashboards update daily. GEO measurement is largely manual, which means it requires intentional frameworks. AI platforms don't expose APIs for "how often do you cite this domain," so you have to build your own tracking systems.
80%
of AI-cited sources don't rank in traditional top 10
GEO visibility doesn't correlate with SEO rankings. A page ranking #15 organically might be the top-cited source in AI responses. This means you can't use traditional SEO metrics as a proxy for GEO performance.
Source: Semrush ResearchThe good news: once you establish a measurement system, GEO progress is often more dramatic than SEO. Going from 0 citations to 5 citations in a month is a measurable, explainable win. Going from position 12 to position 9 in SEO is noise.
Definition
Citation Rate
The percentage of tested queries where your brand is mentioned or linked by AI platforms. Calculated as (queries with mention ÷ total queries tested) × 100. A 20% citation rate means you appear in AI responses for 1 in 5 relevant queries.
Visibility Baseline Prompts
Before optimizing anything, you need to know where you stand. These prompts help you establish a baseline-the starting point from which all progress is measured.
Prompt #86: AI Visibility Baseline Assessment
What it does: You're about to invest time and resources in GEO-but how will you know if it worked? This prompt creates a systematic testing framework so you can measure before and after. It defines which queries to test, which platforms to check, and exactly what to record.
Your input: Your brand name, primary topic area, and 5-10 queries your target audience asks AI platforms.
Expected output: A complete testing protocol with 15-20 queries, platform checklist, recording spreadsheet template, and benchmark interpretation guide.
What to do next: Run the queries manually across ChatGPT, Claude, Perplexity, and Google AI Overviews. Record results in the suggested format. Save this as your Day 0 baseline. Schedule quarterly re-tests.
Copy this prompt:
You are a GEO measurement specialist. Create a comprehensive visibility baseline assessment for the following brand.

Brand: [YOUR BRAND NAME]
Primary Topic Area: [YOUR MAIN EXPERTISE, e.g., "B2B marketing software"]
Sample Queries: [5-10 QUERIES YOUR AUDIENCE ASKS AI]

Create:

1. Query Set (15-20 total)
   Expand the provided queries and add related questions:
   - 5 "What is/are" definitional queries
   - 5 "How to" procedural queries
   - 5 "Best [category]" recommendation queries
   - 2-3 "[Brand] vs [Competitor]" comparison queries
   - 2-3 industry-specific technical queries

2. Testing Protocol
   For each query, record:
   - Platform (ChatGPT, Claude, Perplexity, Google AI Overview)
   - Date tested
   - Mentioned (Y/N)
   - Cited with link (Y/N)
   - Position (if multiple sources cited: 1st, 2nd, 3rd, etc.)
   - Sentiment (positive, neutral, negative, N/A)
   - Competitors mentioned (list names)

3. Spreadsheet Template
   Provide column headers and sample data format
   Include formulas for calculating:
   - Overall citation rate
   - Platform-by-platform citation rate
   - Competitor comparison

4. Interpretation Guide
   What does each citation rate level mean?
   - 0-5%: [interpretation and action]
   - 5-15%: [interpretation and action]
   - 15-30%: [interpretation and action]
   - 30%+: [interpretation and action]

5. Baseline Report Template
   Summary format for documenting Day 0 results
Prompt #87: Citation Monitoring Protocol
What it does: Baseline established-now what? This prompt creates an ongoing monitoring system that's sustainable. Weekly tracking without burning out. The output is a repeatable protocol you or your team can execute in 30 minutes per week.
Your input: Your baseline results from Prompt #86, team capacity (solo/team), and monitoring frequency preference (weekly/bi-weekly).
Expected output: A streamlined monitoring checklist, priority query subset for frequent testing, alert thresholds, and trend tracking template.
What to do next: Implement the weekly monitoring routine. Set calendar reminders. After 4 weeks, run the full baseline assessment again to compare.
Copy this prompt:
You are a GEO monitoring specialist. Design a sustainable citation monitoring protocol.

Baseline Results: [PASTE YOUR BASELINE SUMMARY OR KEY METRICS]
Team Capacity: [SOLO / SMALL TEAM / AGENCY]
Preferred Frequency: [WEEKLY / BI-WEEKLY]

Create:

1. Priority Query Subset (5-7 queries)
   Select from the full baseline query set:
   - 2-3 queries where you're currently cited (monitor for loss)
   - 2-3 queries where you're close to being cited (monitor for wins)
   - 1-2 high-value queries (important even if currently at 0%)
   Explain why each query was selected

2. Weekly Monitoring Checklist
   Step-by-step 30-minute routine:
   - Which platforms to check
   - Exact queries to run
   - What to record
   - How to log results

3. Alert Thresholds
   Define what triggers action:
   - Citation loss: When to investigate
   - Citation gain: When to celebrate/document
   - Competitor movement: When to respond

4. Trend Tracking Template
   Weekly log format showing:
   - Citation count by platform
   - Week-over-week change
   - Notable observations
   - Rolling 4-week average

5. Monthly Summary Format
   Template for compiling weekly data into monthly insights
GEO Measurement Readiness Self-Assessment
- Baseline established - Tested queries across platforms, recorded results
- Query set defined - 15-20 relevant queries for your topic
- Spreadsheet/tracking system in place - Structured format for ongoing recording
- Weekly monitoring routine scheduled - Calendar reminder, 30-minute commitment
- Stakeholder reporting template ready - Format for communicating progress
How to use this checklist: Check off each item as you complete it. If fewer than 3 items are checked, run through Prompts #86 and #87 before any other GEO work. Measurement foundations must come first.
Tracking & Monitoring Prompts
Once you have a baseline and monitoring routine, these prompts help you dig deeper-platform-specific analysis, competitor tracking, and anomaly detection.
Prompt #88: Platform-Specific Tracking Framework
What it does: Different AI platforms cite differently. ChatGPT favors Bing-indexed sources, Perplexity emphasizes recency, Claude prioritizes depth. This prompt creates platform-specific tracking frameworks so you can optimize for each platform's citation preferences.
Your input: Your monitoring data showing which platforms cite you (or don't), and your target platform priority.
Expected output: Platform-specific tracking checklists, optimization recommendations per platform, and priority ranking based on your current performance.
What to do next: Focus optimization efforts on your priority platform first. Use platform-specific insights to adjust content strategy.
Copy this prompt:
You are a multi-platform GEO analyst. Create a platform-specific tracking and optimization framework.

Current Performance by Platform:
[PASTE YOUR CITATION RATES BY PLATFORM, e.g.:
- ChatGPT: 15% citation rate
- Perplexity: 25% citation rate
- Claude: 5% citation rate
- Google AI Overview: 20% citation rate]

Target Platform Priority: [WHICH PLATFORM MATTERS MOST TO YOU]

Create:

1. Platform Citation Behavior Analysis
   For each platform, explain:
   - How it discovers content (index source, crawling behavior)
   - Citation style preferences (what format gets cited)
   - Content freshness weight (how important is recency)
   - Authority signals it prioritizes

2. Platform-Specific Tracking Checklist
   What to specifically monitor on each platform:
   - Unique query types that perform differently
   - Format of citations (link, mention, quote)
   - Competitor patterns on this platform

3. Gap Analysis
   Based on current performance:
   - Which platforms have the biggest improvement opportunity?
   - What's likely causing underperformance on weak platforms?
   - Quick wins for each underperforming platform

4. Priority Ranking
   Order platforms by:
   - Current opportunity (gap between potential and actual)
   - Business value (which platform drives your audience)
   - Effort required (some platforms are harder to optimize for)

5. Platform-Specific Action Items
   Top 3 actions for your weakest platform
Prompt #91: Competitor Visibility Tracker
What it does: GEO isn't just about your own visibility-it's about share of voice. This prompt creates a competitive tracking framework so you can measure how often AI platforms cite you versus your competitors for the same queries.
Your input: Your brand, 3-5 main competitors, and 10-15 queries where you compete for visibility.
Expected output: Competitive visibility tracking template, share of voice calculation, and competitor movement alerts.
What to do next: Run competitive tracking monthly. Identify which competitors dominate which query types. Develop targeted strategies to displace top competitors on high-value queries.
Copy this prompt:
You are a competitive GEO analyst. Create a competitor visibility tracking framework.

Your Brand: [YOUR BRAND NAME]
Competitors: [LIST 3-5 MAIN COMPETITORS]
Competitive Queries: [10-15 QUERIES WHERE YOU ALL COMPETE]

Create:

1. Competitive Tracking Template
   Spreadsheet format with:
   - Query, Platform, Date
   - Your brand: Cited (Y/N), Position
   - Competitor 1: Cited (Y/N), Position
   - Competitor 2: Cited (Y/N), Position
   - [Continue for all competitors]
   - Notes on response quality/context

2. Share of Voice Calculation
   Formula for calculating:
   - Your citations ÷ Total citations across all tracked brands
   - By platform, by query category, overall

3. Competitive Movement Alerts
   When to take action:
   - Competitor displaces you on a query you previously won
   - New competitor appears in citations
   - Competitor citation rate jumps significantly

4. Competitive Intelligence Extraction
   For competitors who outperform you:
   - What content of theirs gets cited?
   - What format do they use?
   - What authority signals do they have?

5. Displacement Strategy Template
   Framework for planning how to overtake a competitor on specific queries
Prompt #95: Anomaly Detection & Opportunity Identifier
What it does: After weeks of monitoring, you'll have data but not necessarily insight. This prompt analyzes your tracking data to identify anomalies (sudden changes), patterns (what's working), and opportunities (gaps to exploit).
Your input: 4+ weeks of monitoring data from your tracking spreadsheet.
Expected output: Anomaly report, pattern analysis, and prioritized opportunity list with specific action recommendations.
What to do next: Investigate any negative anomalies immediately. Double down on positive patterns. Plan content creation around identified opportunities.
Copy this prompt:
You are a GEO data analyst. Analyze the following tracking data for anomalies, patterns, and opportunities.

Tracking Data (4+ weeks):
[PASTE YOUR WEEKLY TRACKING DATA - include dates, queries, platforms, citation results]

Analyze and provide:

1. Anomaly Detection
   Identify significant changes:
   - Queries where citation status changed (gained or lost)
   - Platforms where performance shifted
   - Weeks with unusual patterns
   For each anomaly: What changed, when, possible cause

2. Pattern Analysis
   What's consistently working:
   - Query types where you always get cited
   - Platforms where you perform best
   - Content topics that drive citations
   What's consistently failing:
   - Query types where you never appear
   - Platforms where competitors dominate
   - Gaps in your content coverage

3. Opportunity Identification
   High-potential opportunities:
   - Queries where you're close but not cited (easy wins)
   - Topics with high AI query volume but low competition
   - Platform-specific opportunities based on your strengths

4. Risk Assessment
   Vulnerabilities to address:
   - Citations at risk of displacement
   - Competitor trends threatening your position
   - Content freshness issues

5. Prioritized Action List
   Top 5 actions ranked by:
   - Impact potential (high/medium/low)
   - Effort required (high/medium/low)
   - Urgency (immediate/this month/this quarter)
Pro Tip
Run Prompt #95 monthly, not weekly. Weekly anomaly detection creates noise-you need enough data for patterns to emerge. After running, cross-reference identified opportunities with your content calendar and plan creation accordingly.
Reporting & Stakeholder Prompts
Data without communication is useless. These prompts transform raw tracking data into stakeholder-friendly reports that demonstrate progress and justify continued investment.
Prompt #92: GEO Progress Report Generator
What it does: You've got tracking data showing improvement-now you need to communicate it. This prompt transforms raw citation data into a professional report with executive summary, key metrics, notable wins, and recommended next steps.
Your input: Your baseline data, current tracking data, and any notable citation wins (screenshots, specific examples).
Expected output: A structured monthly progress report with sections formatted for non-technical stakeholders.
What to do next: Customize the output with your branding. Add screenshots of actual citations. Present monthly or include in regular marketing reports.
Copy this prompt:
You are a GEO reporting specialist. Create a monthly progress report from the following data.

Baseline Data (from [BASELINE DATE]):
[PASTE BASELINE METRICS - citation rate, platform breakdown, key queries]

Current Data (from [CURRENT DATE]):
[PASTE CURRENT METRICS - same format as baseline]

Notable Citations This Period:
[LIST ANY SPECIFIC CITATIONS YOU CAPTURED - query, platform, how you were mentioned]

Generate a GEO Monthly Progress Report with:

1. Executive Summary (4-5 sentences max)
   - Overall visibility change (percentage points, not just percentages)
   - Most significant win this period
   - Biggest challenge or risk
   - Key recommendation for next month

2. Key Metrics Dashboard
   Format as a simple metrics grid:
   - Citation Rate: [X%] → [Y%] ([+/-Z] points)
   - Queries Tracked: [N]
   - Platforms Monitored: [list]
   - Share of Voice vs Competitors: [X%]

3. Platform Performance Breakdown
   For each platform:
   - Current citation rate
   - Change from baseline
   - Trend direction (improving, stable, declining)

4. Notable Citations
   Highlight 2-3 best citations:
   - Query that triggered it
   - Platform
   - How you were mentioned (link, quote, recommendation)
   - Why this matters (business impact)

5. Competitive Movement
   - Any competitors gained or lost ground?
   - Queries where you displaced a competitor
   - Queries where you lost position

6. Challenges & Risks
   - What's not working
   - External factors affecting performance
   - Areas needing attention

7. Recommended Next Actions
   Top 3 priorities for next month:
   - Action, expected impact, effort level

8. Appendix: Raw Data
   Reference to full tracking spreadsheet

Format for non-technical stakeholders. Use plain language, avoid jargon, lead with impact.
Prompt #93: ROI Calculator Framework
What it does: The inevitable question: "What's the ROI?" This prompt creates a framework for estimating the business value of AI citations-connecting visibility improvements to traffic, leads, and revenue where possible.
Your input: Your citation metrics, any traffic data from AI sources (check GA4 for AI referrals), and your typical conversion/revenue metrics.
Expected output: An ROI calculation framework with conservative, moderate, and optimistic estimates plus methodology documentation.
What to do next: Present the range, not a single number. Document assumptions clearly. Update estimates quarterly as you get more data.
Copy this prompt:
You are a marketing ROI analyst. Create a GEO ROI estimation framework.

Available Data:
Citation Metrics: [YOUR CITATION RATE AND COUNT]
AI Referral Traffic (if available): [SESSIONS FROM AI PLATFORMS - check GA4]
Average Conversion Rate: [YOUR SITE'S CONVERSION RATE]
Average Customer Value: [YOUR TYPICAL DEAL SIZE OR LTV]
GEO Investment: [HOURS/COST INVESTED IN GEO]

Create:

1. ROI Calculation Framework
   Step-by-step methodology:
   - Estimate impressions from AI citations
   - Estimate click-through from citations to site
   - Apply conversion rate
   - Calculate revenue impact
   Document assumptions at each step

2. Three-Scenario Estimates
   Conservative (pessimistic assumptions):
   - Low CTR, low conversion multiplier
   - Result: $[X] estimated value

   Moderate (realistic assumptions):
   - Industry-average assumptions
   - Result: $[Y] estimated value

   Optimistic (best-case assumptions):
   - High engagement, compounding effects
   - Result: $[Z] estimated value

3. Non-Revenue Value Factors
   What ROI doesn't capture:
   - Brand awareness value
   - Competitive displacement value
   - Future-proofing value
   - Credibility/trust building

4. Data Gaps & Improvement Plan
   What additional data would improve estimates:
   - Tracking recommendations
   - Attribution improvements
   - Conversion tracking for AI traffic

5. Presentation Format
   One-page ROI summary for executives:
   - Investment, estimated return, range
   - Confidence level in estimates
   - What would increase confidence
Different prompts serve different reporting rhythms. Use this guide to build your measurement routine-the day count badges show how frequently each cycle runs, helping you plan your GEO tracking schedule.
GEO Reporting Frequency Guide
Weekly
Quick monitoring pulse
5 priority queries
Monthly
Progress report to stakeholders
Full query set
Quarterly
Full baseline refresh + ROI estimation
Annually
Strategic review + next year planning
Stakeholder Communication Transformation
Measurement Implementation Workflow
Here's how to implement a complete GEO measurement system using these prompts:
GEO Measurement Setup Checklist
- Run Prompt #86 to establish baseline - Takes 2-3 hours for first-time setup
- Create spreadsheet using Prompt #86 output template
- Test all queries across all platforms (ChatGPT, Claude, Perplexity, Google AI Overview)
- Document Day 0 results as baseline report
- Set up weekly monitoring routine with Prompt #87
- Schedule calendar reminder for weekly 30-minute tracking session
- After Week 4: Run Prompt #95 for first anomaly/opportunity analysis
- Generate first monthly report with Prompt #92
- Present to stakeholders with Prompt #93 ROI framework
Note
Start with just 10 queries and 2 platforms if the full baseline feels overwhelming. You can expand later. The key is starting-imperfect measurement beats no measurement.
FAQ
How often should I run visibility tracking prompts?
What tools do I need to use these measurement prompts?
How do I measure AI citations if there's no formal tracking system?
Can I use these prompts for competitor tracking?
What's a good citation rate benchmark?
Want the Complete 100-Prompt Toolkit?
This post covers Category 3 (prompts 86-95). The full GEO Accelerator Toolkit includes 100 prompts across 6 categories.
The complete toolkit is available in the GEO Accelerator Course.
Take the GEO Readiness Quiz →60 seconds · Personalized report · Free
Continue Learning
Dive deeper into AI search with these related articles:
The GEO Accelerator Toolkit: AI Prompts for Every Stage of Optimization
100 copy-paste AI prompts organized into 6 categories covering entity building, content structuring, AI platform optimization, digital PR, and measurement. Sample prompts from each category included.
Measuring GEO Success: Complete Analytics Framework
The definitive guide to GEO measurement. Track AI citations, measure Share of Voice, calculate ROI, and build dashboards that prove AI visibility impact.
Setting Up AI Citation Monitoring: Step-by-Step Guide
Complete setup guide for tracking AI citations across ChatGPT, Claude, Perplexity, and Google AI Overviews. GA4 configuration, Geoptie setup, manual protocols, and dashboard templates.